An HTML canvas cannot be converted to SVG directly, because the canvas keeps pixels and SVG keeps shapes. There is no toSVG method and no browser API that recovers geometry from a bitmap.
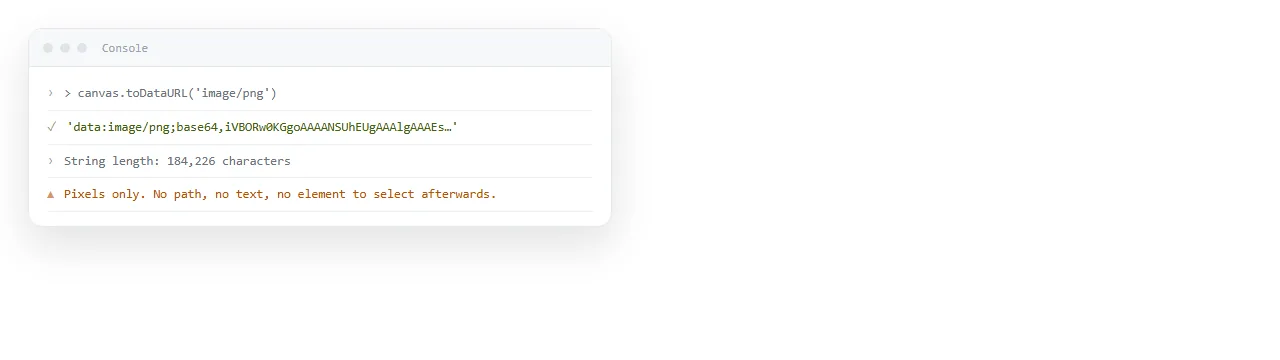
What exists is toDataURL and toBlob, which give you a PNG. That is a raster, and putting a raster inside an SVG wrapper does not make it vector.
The three routes, and what each actually gives you
| Route | Result | Scales sharply | Editable in a vector tool |
|---|---|---|---|
toDataURL into an SVG <image> |
SVG file, raster inside | No | No |
| Record the 2d context calls | Real SVG paths | Yes | Yes |
| Redraw from your source data | Real SVG elements | Yes | Yes |
Only the bottom two produce vector output. The top one is worth knowing because it takes a minute and is sometimes enough.
Route one: wrap the bitmap
If the requirement is a file with an .svg extension rather than genuine vector output, this is the fastest path.
const png = canvas.toDataURL('image/png');
const svg =
  '<svg xmlns="http://www.w3.org/2000/svg" width="' + canvas.width +
  '" height="' + canvas.height + '">' +
  '<image href="' + png + '" width="' + canvas.width +
  '" height="' + canvas.height + '"/></svg>';
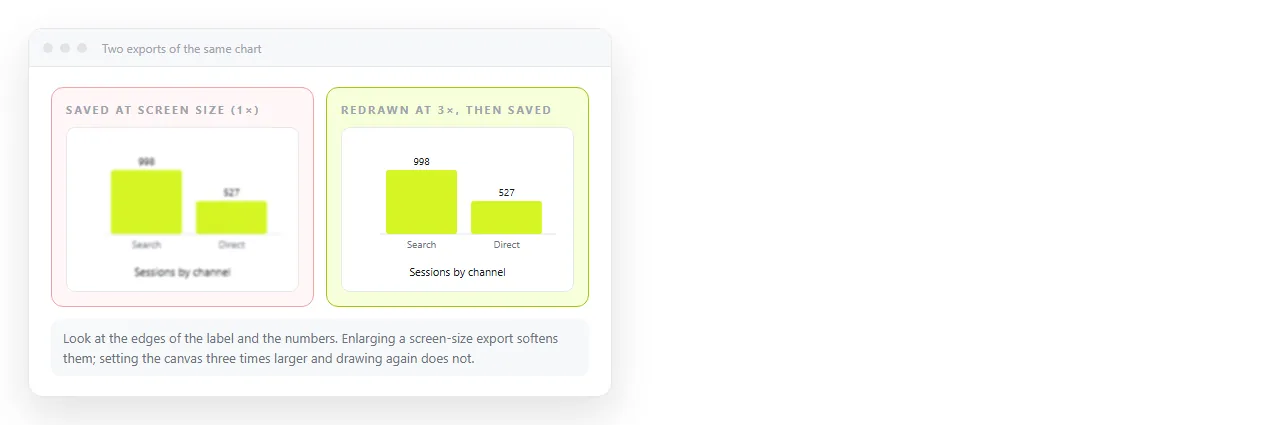
The file opens in browsers and design tools. The content is the same pixels at the same resolution, so it blurs on zoom exactly as the PNG would. Draw the canvas at two or three times size first if it is headed for print.
Route two: record the draw calls
Several small libraries replace the 2d context with a recording object. Your existing drawing code runs unchanged, and each lineTo or fillRect becomes an SVG element instead of pixels.
// the drawing function takes a context and does not care what kind it is
function drawScene(ctx) {
  ctx.fillStyle = '#38bdf8';
  ctx.fillRect(20, 20, 160, 80);
  ctx.beginPath();
  ctx.arc(300, 150, 60, 0, Math.PI * 2);
  ctx.fill();
}
Written that way, the same function can be handed a real canvas context for the screen and a recording context for the export. Keeping the draw code independent of where it draws is worth doing even if you never export.
Two limits to expect. Pixel level operations such as getImageData, putImageData and composite blend modes have no SVG equivalent and are dropped. And a scene with a hundred thousand calls becomes an SVG file large enough to stall a browser.
Route three: redraw from the data
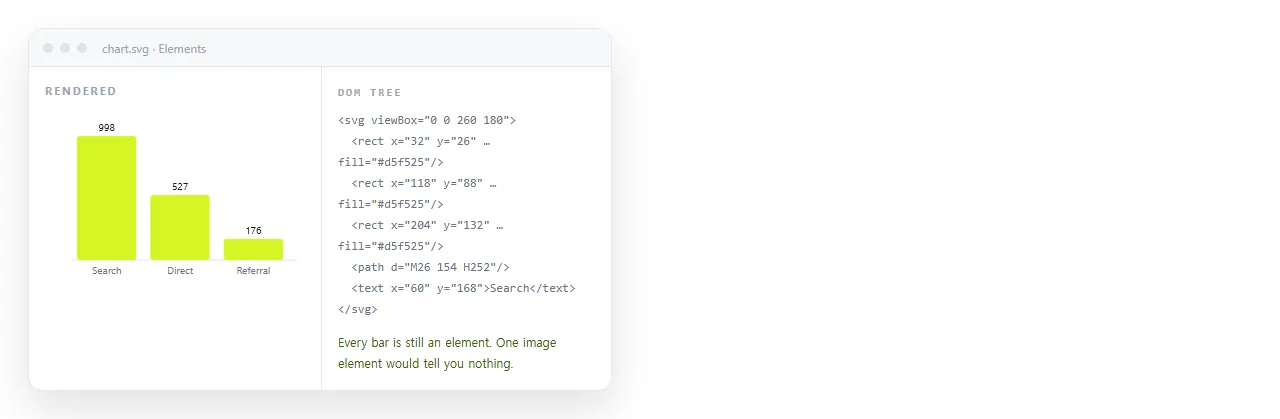
Usually the right answer. The chart came from an array. Render that array into SVG elements and you get output that is smaller, sharper and interactive.
<svg viewBox="0 0 600 300" width="100%">
  <polyline fill="none" stroke="#38bdf8" stroke-width="2"
            points="60,220 160,170 260,200 360,120 460,150 560,80"/>
  <text x="60" y="210" fill="#e2e8f0" font-size="12">40</text>
</svg>
The advantages compound. Shapes take hover and click handlers. Colours come from CSS, so changing a colour is a rule rather than a re export. The viewBox handles scaling with no device pixel ratio arithmetic. It prints properly.
If you are choosing now rather than converting later, canvas drawing lists the cases where canvas is still the correct pick.
The usual objection is performance, and it is often based on a number that never applies. A few hundred SVG elements is not slow in any current browser.
The threshold where canvas pulls ahead sits in the low thousands of shapes, or at any scene that is redrawn every frame.
There is also a middle path worth knowing. Draw the dense layer on a canvas and put the labels, legend and interactive markers in SVG on top of it. The heavy part stays fast and the parts a reader touches stay real elements.
What no route can recover
Anything that was never in your data. If the canvas came from a paint tool, a video frame, or an image filter, there is no underlying geometry to rebuild.
Automatic tracing is a guess. It produces thousands of path points that look approximately like the original and are unpleasant to edit afterwards.
For those cases, accept the raster. HTML to image captures the rendered page at the size you ask for, which is the honest version of the same result.
Choosing a target resolution if you stay raster
- Multiply the canvas attribute size by 2 or 3 before drawing the export copy.
- Redraw the scene at that size rather than scaling the finished bitmap.
- Divide line widths and font sizes by the same factor if your code hard codes them.
- Export with
toBlobrather thantoDataURLfor anything large, since the data URI string can get very long.
Getting the result to someone else
A vector export is a file, and files have the usual delivery problems. An SVG attachment often opens as markup rather than a picture.
Paste the page into a NOS document instead and send the link. Whether the chart is canvas, SVG, or both, it renders as written with the scripts running.
The address stays the same when the numbers change, so nobody is holding a frozen export from two weeks ago. That is the same route used for any chart shared as a link.
A short decision rule
| You need | Do this |
|---|---|
A file named .svg, contents unimportant |
Wrap the PNG in an SVG image element |
| Print quality output of an existing canvas | Record the draw calls, or redraw from data |
| An editable file for a designer | Redraw from data as SVG elements |
| A picture for a ticket or a slide | Export PNG at two or three times size |
| Someone to look at the chart | Send the live page as a link |
The last row is the one that gets skipped. Conversion is usually asked for because a file was the only delivery method considered, and an address removes the requirement entirely.