A one page research summary is a single page that holds the claim, the question, the method, the result, the limits and what you need from the reader. An advisor or committee member can judge the work in a couple of minutes.
If slides feel like the wrong shape for that job, a short web page you send as a link is one alternative.
Here is a finished example, built on invented data. Tap a bar for its number, and open "Sample and measures" to see the detail that stays out of the way until someone wants it.
<!doctype html>
<html lang="en">
<head>
<meta charset="utf-8">
<meta name="viewport" content="width=device-width, initial-scale=1">
<title>One page research summary</title>
<style>
* { box-sizing: border-box; }
body { margin: 0; padding: 16px; font-family: system-ui, sans-serif; color: #1f2430; background: #eef0f4; line-height: 1.5; }
.page { max-width: 720px; margin: 0 auto; background: #fff; border-radius: 12px; padding: 22px 24px 20px; box-shadow: 0 2px 12px rgba(0,0,0,.08); }
.meta { font-size: 12.5px; color: #5b6472; margin: 0 0 6px; }
h1 { font-size: 22px; line-height: 1.25; margin: 0 0 4px; }
.by { font-size: 14px; color: #3b4452; margin: 0 0 14px; }
.claim { background: #eef4ff; border-left: 4px solid #2f5fd0; padding: 10px 14px; border-radius: 0 8px 8px 0; font-size: 15.5px; margin: 0 0 16px; }
h2 { font-size: 12.5px; letter-spacing: .06em; text-transform: uppercase; color: #2f5fd0; margin: 16px 0 4px; }
p { margin: 0 0 6px; font-size: 15px; }
details { margin-top: 4px; font-size: 14px; }
summary { cursor: pointer; color: #2f5fd0; }
details p { font-size: 14px; color: #3b4452; margin-top: 6px; }
.tiles { display: grid; grid-template-columns: repeat(3, 1fr); gap: 8px; margin: 8px 0 12px; }
.tile { border: 1px solid #dfe3ea; border-radius: 8px; padding: 8px 10px; text-align: center; }
.tile b { display: block; font-size: 20px; }
.tile span { font-size: 12px; color: #5b6472; }
.fig { border: 1px solid #dfe3ea; border-radius: 8px; padding: 10px 12px 8px; }
.fig svg { display: block; width: 100%; height: auto; }
.bar { cursor: pointer; }
.bar:focus { outline: 2px solid #1f2430; }
.cap { font-size: 12.5px; color: #3b4452; margin: 6px 0 0; }
#readout { min-height: 20px; font-size: 13.5px; font-weight: 600; margin: 6px 0 0; }
ul { margin: 4px 0 0; padding-left: 20px; font-size: 15px; }
li { margin-bottom: 3px; }
.ask { background: #fff8e6; border: 1px solid #f0d58a; border-radius: 8px; padding: 8px 14px 10px; margin-top: 4px; }
.ask h2 { color: #8a5a00; margin-top: 6px; }
.foot { margin: 14px 0 0; padding-top: 8px; border-top: 1px solid #e3e6ec; font-size: 12.5px; color: #5b6472; }
@media (max-width: 480px) { .page { padding: 16px 14px; } h1 { font-size: 19px; } .tile b { font-size: 17px; } }
</style>
</head>
<body>
<main class="page">
<p class="meta">Example with invented data · Thesis chapter 3 · For the committee meeting on 14 November</p>
<h1>Short quizzes before lab and recall of safety rules</h1>
<p class="by">Mira Okonkwo, MSc candidate · Supervisor: Dr. Jan Halvorsen</p>
<p class="claim"><b>Main claim:</b> A five-question quiz at the start of lab raised recall of safety rules by 13 points over re-reading the handout.</p>
<h2>Question</h2>
<p>Do first-year chemistry students remember safety rules better after a short retrieval quiz than after re-reading the handout?</p>
<h2>Method</h2>
<p>Two lab groups in one term. One group took a quiz, the other re-read the handout. Both were tested a week later.</p>
<details>
<summary>Sample and measures</summary>
<p>84 students in four sections. The quiz had five open questions. The follow-up test had ten items, scored by two markers who did not know the group.</p>
</details>
<h2>Result</h2>
<div class="tiles">
<div class="tile"><b>71%</b><span>quiz group</span></div>
<div class="tile"><b>58%</b><span>handout group</span></div>
<div class="tile"><b>n = 84</b><span>students</span></div>
</div>
<div class="fig">
<svg viewBox="0 0 400 130" role="img" aria-label="Bar chart: quiz group 71 percent, handout group 58 percent">
<line x1="60" y1="108" x2="390" y2="108" stroke="#c9ced8"/>
<g class="bar" tabindex="0" data-text="Quiz group: 71% of follow-up items correct (42 students)">
<rect x="110" y="30" width="80" height="78" rx="4" fill="#2f5fd0"/>
<text x="150" y="24" text-anchor="middle" font-size="14" font-weight="700" fill="#1f2430">71%</text>
</g>
<g class="bar" tabindex="0" data-text="Handout group: 58% of follow-up items correct (42 students)">
<rect x="240" y="44" width="80" height="64" rx="4" fill="#9aa5b8"/>
<text x="280" y="38" text-anchor="middle" font-size="14" font-weight="700" fill="#1f2430">58%</text>
</g>
<text x="150" y="124" text-anchor="middle" font-size="12" fill="#3b4452">Quiz</text>
<text x="280" y="124" text-anchor="middle" font-size="12" fill="#3b4452">Handout</text>
<text x="54" y="112" text-anchor="end" font-size="11" fill="#5b6472">0</text>
</svg>
<p id="readout">Tap a bar for its number.</p>
<p class="cap">Figure 1. Share of follow-up items answered correctly, one week after the lab.</p>
</div>
<h2>Limits</h2>
<ul>
<li>Two groups from one term, not randomised by student.</li>
<li>Only one week between lab and test.</li>
</ul>
<div class="ask">
<h2>What I need from the committee</h2>
<ul>
<li>Is a four-week follow-up worth adding to chapter 4?</li>
<li>Should the limits above move into the abstract?</li>
</ul>
</div>
<p class="foot">Full draft available from the author on request. Numbers on this page are invented for the example.</p>
</main>
<script>
const readout = document.getElementById('readout');
document.querySelectorAll('.bar').forEach((bar) => {
const show = () => { readout.textContent = bar.dataset.text; };
bar.addEventListener('click', show);
bar.addEventListener('keydown', (e) => { if (e.key === 'Enter' || e.key === ' ') { e.preventDefault(); show(); } });
});
</script>
</body>
</html>
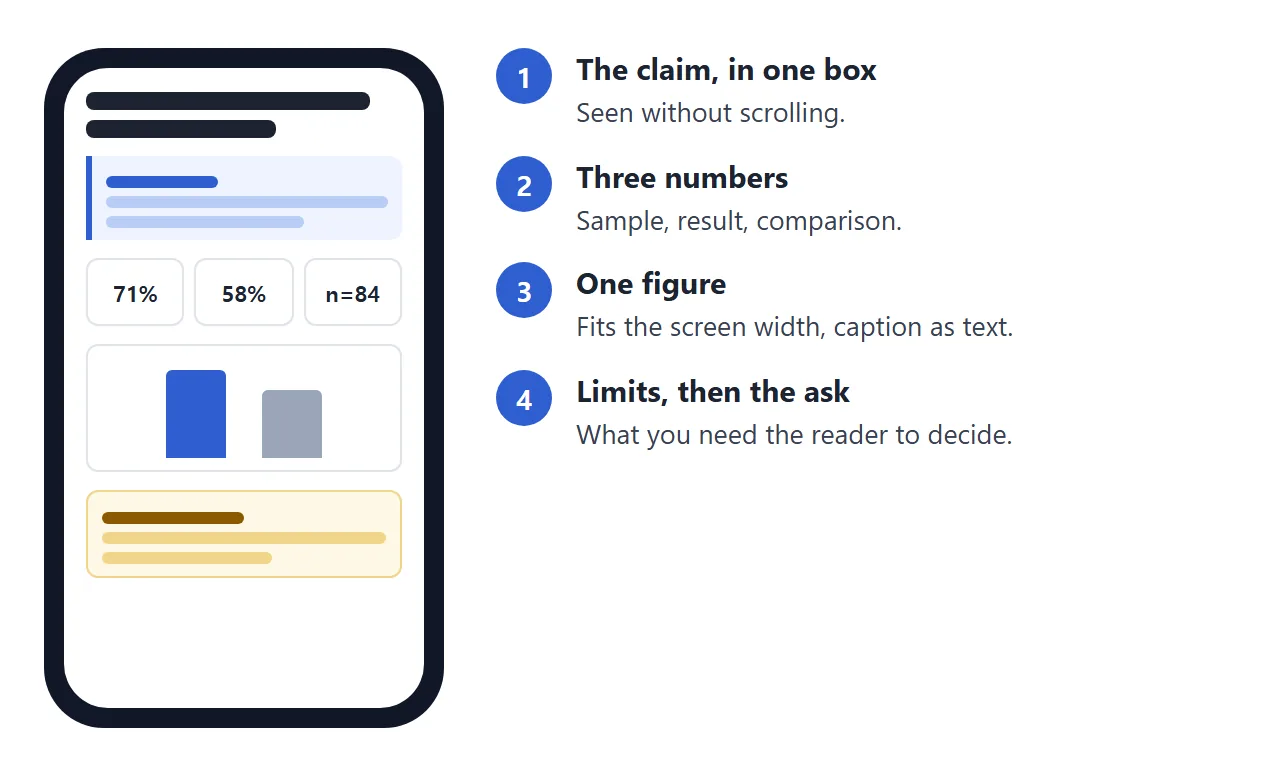
The example opens with the main claim in a box, then gives three numbers and one figure. The last box asks the committee for something specific. A reader who stops after the first screen still knows what you found and what you want.
What goes on the page
Five blocks, in this order: claim, question, method, result, limits. Then a short box called "What I need from the committee". The claim comes first because that is what people want to check before anything else.
Give each block a word budget. The numbers below are a starting point, not a rule. Ask your advisor what your committee expects.
| Part | What it holds | Starting budget |
|---|---|---|
| Question | One sentence a non-specialist could follow | 40 words |
| Method | Who, how many, what you measured | 60 words |
| Result | The numbers the committee will ask about first | 80 words |
| Limits | What the result does not show | 50 words |
| Ask | What you need the committee to decide | 40 words |
Try the budget before you write the real thing. The page below counts the words in each part and shows when the total runs over.
<!doctype html>
<html lang="en">
<head>
<meta charset="utf-8">
<meta name="viewport" content="width=device-width, initial-scale=1">
<title>Word budget for a one page summary</title>
<style>
  * { box-sizing: border-box; }
  body { margin: 0; padding: 16px; font-family: system-ui, sans-serif; color: #1f2430; background: #eef0f4; }
  .wrap { max-width: 720px; margin: 0 auto; }
  h1 { font-size: 19px; margin: 0 0 4px; }
  .lead { font-size: 14px; color: #4a5361; margin: 0 0 12px; }
  .total { position: sticky; top: 0; background: #fff; border-radius: 10px; padding: 10px 14px; box-shadow: 0 2px 8px rgba(0,0,0,.1); margin-bottom: 12px; }
  .total b { font-size: 18px; }
  .track { height: 8px; background: #e3e6ec; border-radius: 4px; margin-top: 6px; overflow: hidden; }
  .fill { height: 100%; width: 0; background: #2f8a4d; transition: width .15s; }
  .fill.over { background: #d9531e; }
  .box { background: #fff; border-radius: 10px; padding: 10px 14px 12px; margin-bottom: 10px; }
  .head { display: flex; justify-content: space-between; align-items: baseline; gap: 8px; }
  label { font-weight: 700; font-size: 14px; }
  .hint { font-size: 12.5px; color: #5b6472; margin: 0 0 4px; }
  .count { font-size: 13px; color: #2f8a4d; white-space: nowrap; }
  .count.over { color: #d9531e; font-weight: 700; }
  textarea { width: 100%; min-height: 84px; font: inherit; font-size: 14.5px; padding: 8px 10px; border: 1px solid #cbd1db; border-radius: 8px; resize: vertical; }
</style>
</head>
<body>
<div class="wrap">
  <h1>Word budget for a one page summary</h1>
  <p class="lead">Write each part. The count turns orange when a part runs over its budget.</p>

  <div class="total">
    <b id="sum">0</b> of <span id="cap">0</span> words
    <span id="state"></span>
    <div class="track"><div class="fill" id="bar"></div></div>
  </div>

  <div id="boxes"></div>
</div>

<script>
  // Edit the budgets to fit your own page
  const PARTS = [
    { name: 'Question',  words: 40, hint: 'One sentence a non-specialist could follow.',
      text: 'Do first-year students remember safety rules better after a short quiz than after re-reading the handout?' },
    { name: 'Method',    words: 60, hint: 'Who, how many, what you measured.',
      text: 'Two lab groups in one term. One took a five-question quiz, the other re-read the handout. Both were tested a week later.' },
    { name: 'Result',    words: 80, hint: 'The numbers the committee will ask about first.',
      text: '' },
    { name: 'Limits',    words: 50, hint: 'What the result does not show.',
      text: '' },
    { name: 'Ask',       words: 40, hint: 'What you need from the committee.',
      text: '' }
  ];

  const boxes = document.getElementById('boxes');
  const count = (s) => s.trim().split(/\s+/).filter(Boolean).length;
  const cap = PARTS.reduce((n, p) => n + p.words, 0);
  document.getElementById('cap').textContent = cap;

  PARTS.forEach((p, i) => {
    const box = document.createElement('div');
    box.className = 'box';
    box.innerHTML =
      '<div class="head"><label for="t' + i + '">' + p.name + '</label><span class="count" id="c' + i + '"></span></div>' +
      '<p class="hint">' + p.hint + '</p>' +
      '<textarea id="t' + i + '"></textarea>';
    boxes.appendChild(box);
    const ta = box.querySelector('textarea');
    ta.value = p.text;
    ta.addEventListener('input', update);
  });

  function update() {
    let sum = 0;
    PARTS.forEach((p, i) => {
      const n = count(document.getElementById('t' + i).value);
      sum += n;
      const c = document.getElementById('c' + i);
      c.textContent = n + ' / ' + p.words;
      c.classList.toggle('over', n > p.words);
    });
    document.getElementById('sum').textContent = sum;
    const bar = document.getElementById('bar');
    bar.style.width = Math.min(100, (sum / cap) * 100) + '%';
    bar.classList.toggle('over', sum > cap);
    document.getElementById('state').textContent = sum > cap ? ' - over, cut something' : '';
  }
  update();
</script>
</body>
</html>
The budgets sit in one list near the top of the code, so you can change them to match your own page.
Make it with AI
Paste this into ChatGPT, Claude or Gemini, and put your own text at the end.
I am a graduate student. Turn the text below into ONE self-contained HTML page (HTML, CSS and a little JavaScript, no external files, no images from the web) that works as a one page research summary for my advisor and thesis committee.

Layout, in this order:
1. Title, my name, my supervisor's name, and a one-line status such as "Draft for committee meeting".
2. A box with the main claim in one sentence.
3. Question, Method, Result and Limits, two or three sentences each.
4. Three key numbers in a row, and one simple bar chart drawn with inline SVG from the numbers I give you.
5. A box called "What I need from the committee" with two questions.

Rules: use only the numbers and facts in my text. If something is missing, write [missing] instead of guessing. Keep it under 300 words and make it readable on a phone.

My text:
[paste the abstract, the main results and the limits here]
The "[missing]" rule follows Anthropic's advice to let the model admit uncertainty. Anthropic also says such techniques reduce wrong output but do not remove it, so the check in the next section is not optional.
Check the result before you send it
An AI can reword a sentence and quietly change a figure with it. Read the page against your paper, line by line.
| Check | What to compare |
|---|---|
| Numbers | Sample size, percentages, p-values, units and confidence intervals, exactly as in the paper |
| Names | Your name, your supervisor's name, the journal or course, the date |
| Claims | The main claim must say no more than the paper does. Move anything stronger into limits |
| The chart | The bars must match the numbers, and the axis must start where you expect |
| [missing] markers | Fill each one or delete the sentence |
Rules for unpublished work are yours to check. Before you paste results into any AI chat, ask your advisor and read your publisher's and lab's rules.
Send it as a link
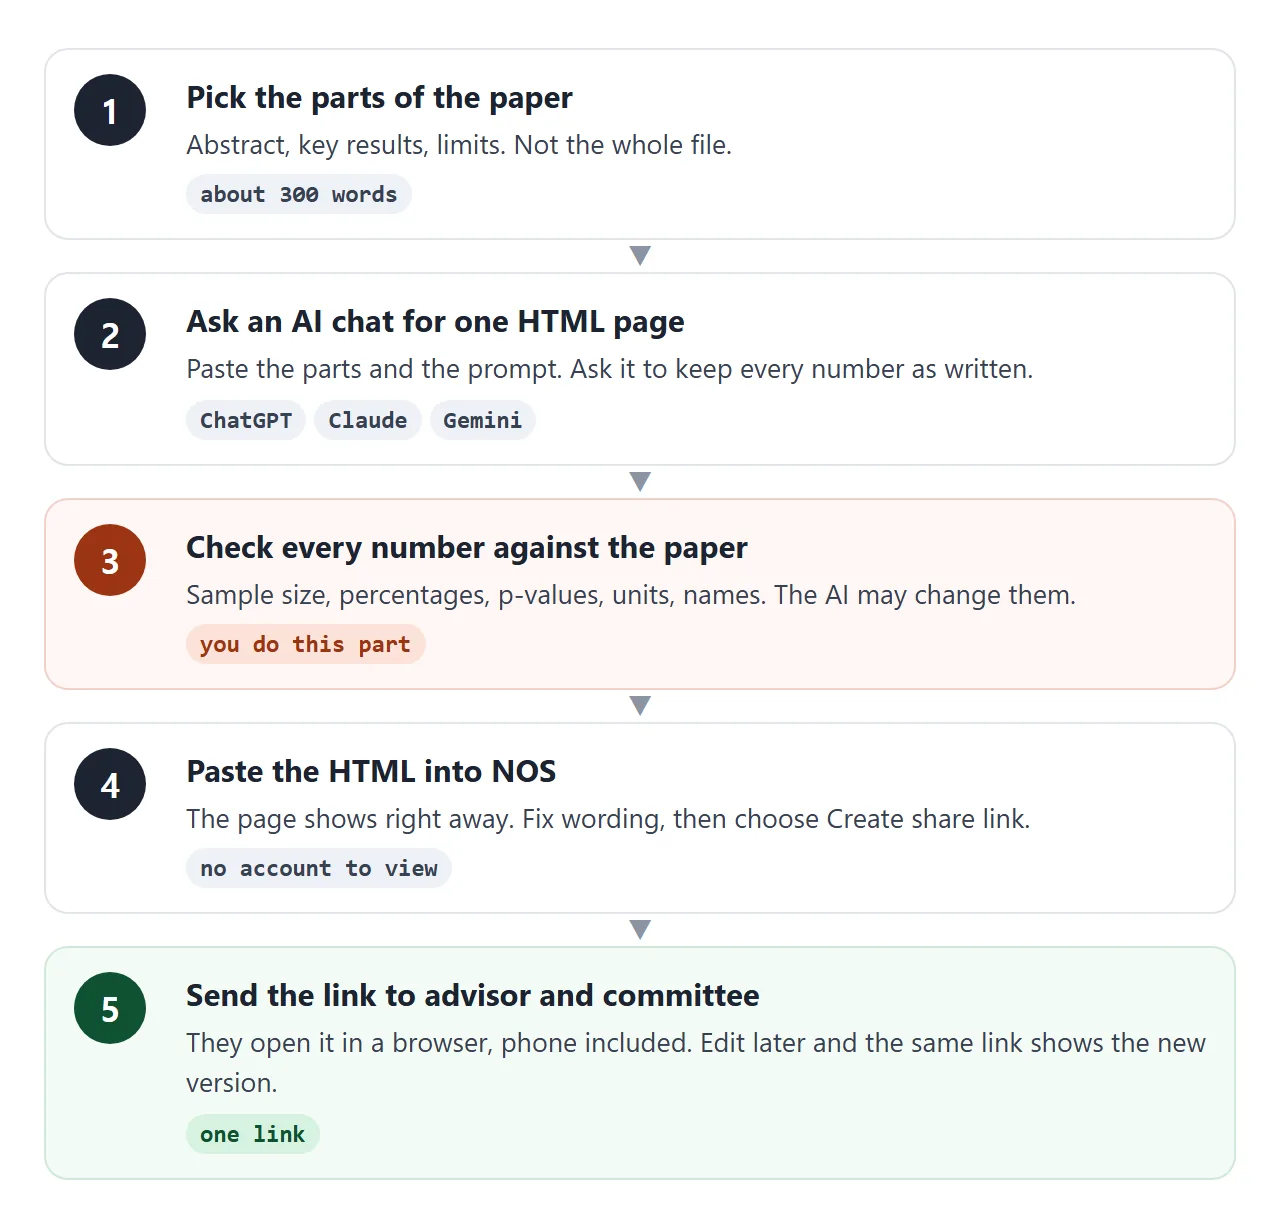
Copy the finished HTML, paste it into a NOS document and choose Create share link. HTML to link walks through it. The page renders as written, with its scripts running, so the bars and the collapsible detail work for the people you send it to.
Anyone with the link can open it in a browser on a computer or a phone, with no account, and cannot edit it. If you fix a number later, the same link shows the new version. The committee does not need a fresh email.
Draw the figure with inline SVG or CSS, as the example does. Images loaded from other websites are blocked on the page.
For a paper copy or a poster, a QR code can point to the same link. For the longer paper, see sharing a research paper as a link and sharing a thesis as a link.
Link or attachment
| Attachment | Link to the page | |
|---|---|---|
| What the reader gets | A copy of your file | The page itself |
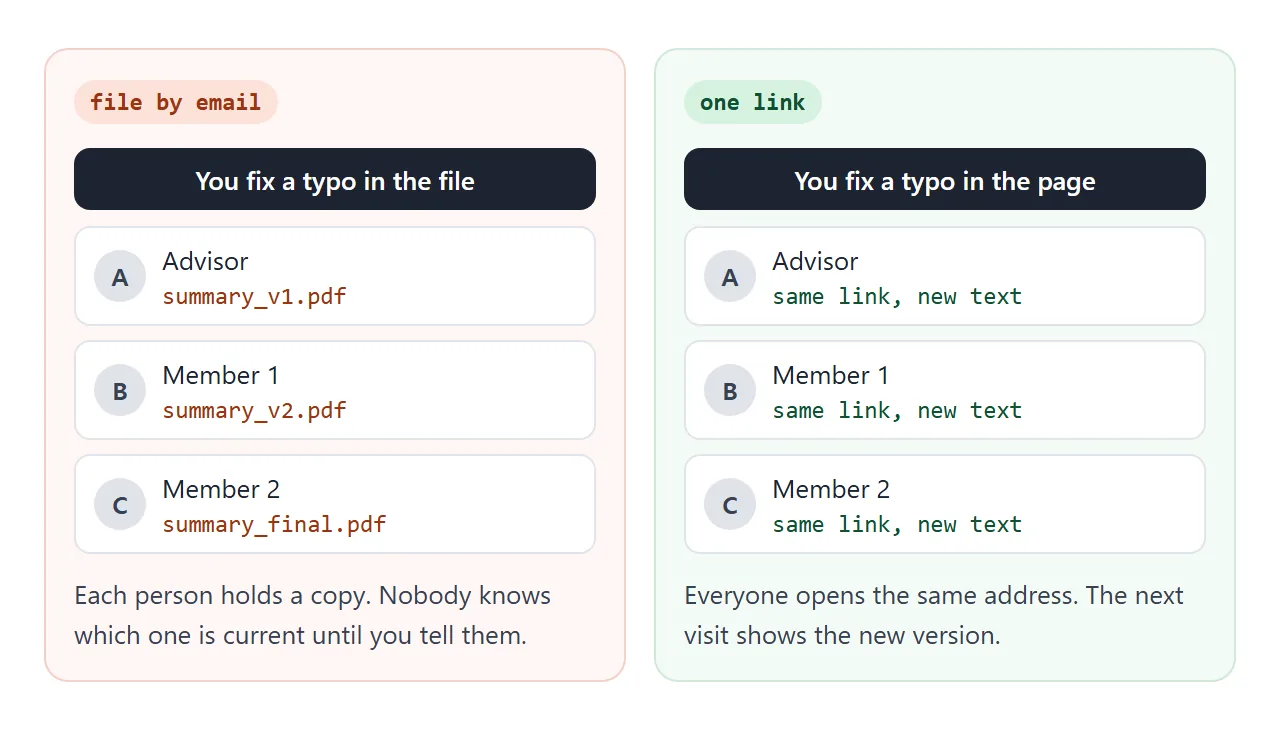
| After you fix a typo | Send again and say which one is current | Same link shows the new text |
| Interactive parts | Not in a plain document | Bars, collapsible detail |
| On a phone | An .html file may open as plain code | Opens as a page in the browser |
| Size | Gmail's help page gives 25 MB for personal accounts, as of October 2026 | A link is a line of text |
| Who can open it | Whoever receives the file | Anyone who has the link |
If you want to see why a file can open as code on a phone, read opening an HTML file on a phone. For the general case, why links beat attachments covers it.
When it does not work
| What you see | Cause | Fix |
|---|---|---|
| A number differs from the paper | The AI reworded the text and changed it | Compare with the paper and fix it in the page, or ask again with "use only the numbers I gave" |
| The figure is blank | The chart is an image from another website, which is blocked | Ask for the chart as inline SVG |
| The page runs past one screen of text | Too many words in method or result | Use the word budget and move detail into a collapsible block |
| A reader sees code on a phone | You sent the HTML file as an attachment | Send the link instead |
| Someone reads an old version | They hold a copy you sent earlier | Send the link once and edit the page |
| Someone wants it on paper | Printing, not screens | See HTML to PDF on one page |