A survey results report template is a page with a fixed order: a headline finding, one summary table per question, two or three key quotes, and what happens next. You paste in the counts and the page builds the tables.
People who never saw the spreadsheet can then read the results.
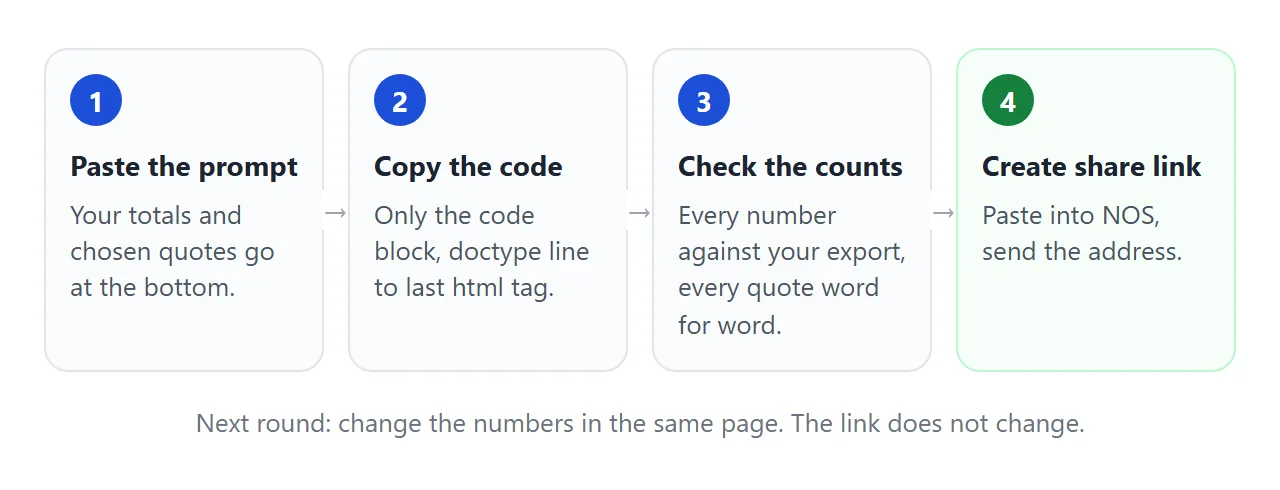
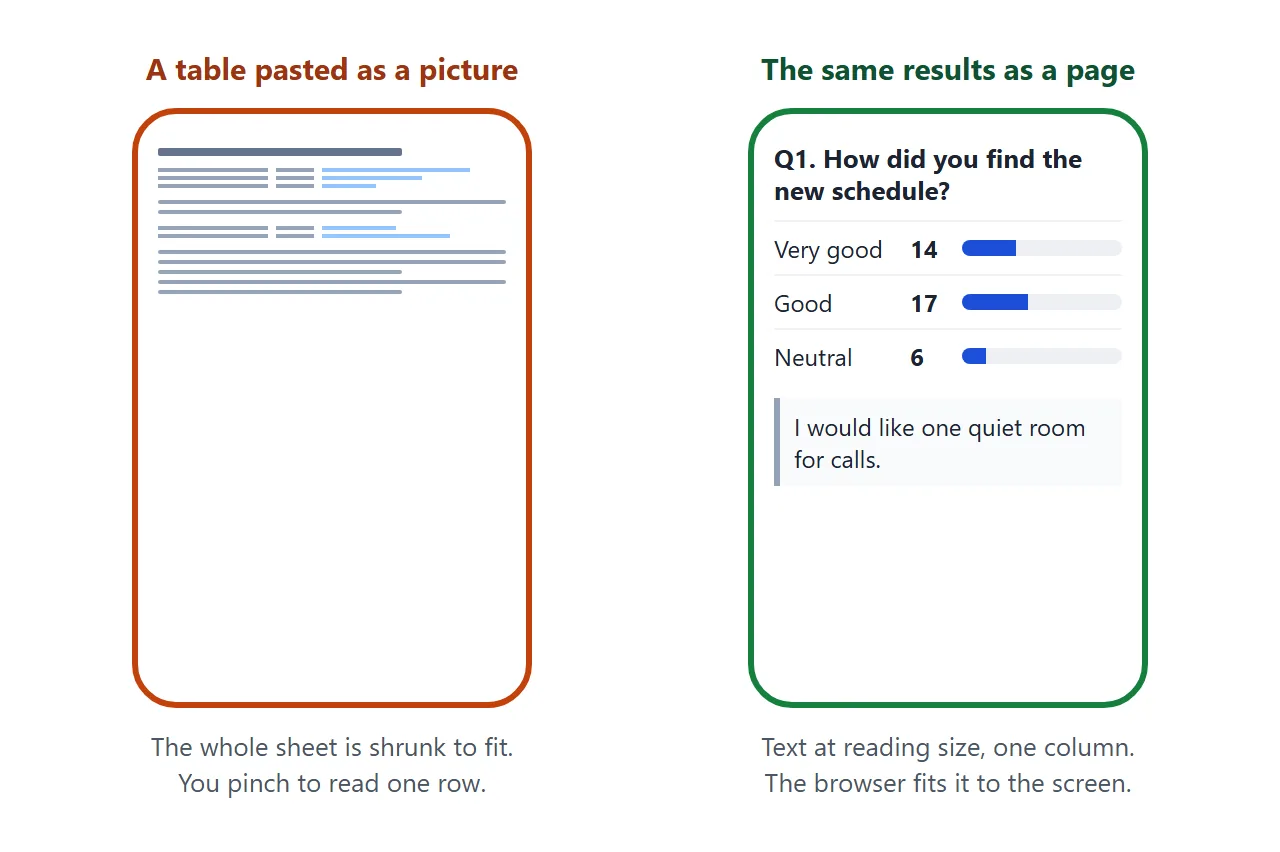
Getting that page out of a tool is where it tends to go wrong. One person, writing about exporting from Claude, put it this way: "save as pdf, layout shifts. always end up just screenshotting."
A page skips the export step, because the browser lays it out for the screen that opens it. Here is a finished one. The totals, quotes and next steps are one block at the top of the script. Edit them and the page rebuilds itself.
<!doctype html>
<html lang="en">
<head>
<meta charset="utf-8">
<meta name="viewport" content="width=device-width, initial-scale=1">
<title>Survey results</title>
<style>
  * { box-sizing: border-box; }
  body { margin: 0; background: #f4f5f7; color: #1d2330; font: 16px/1.5 system-ui, sans-serif; }
  .page { max-width: 720px; margin: 0 auto; padding: 20px 16px 40px; }
  header h1 { font-size: 24px; line-height: 1.25; margin: 0 0 4px; }
  .meta { color: #5b6472; font-size: 15px; margin: 0 0 16px; }
  .headline { background: #ecfdf5; border-left: 5px solid #15803d; border-radius: 8px; padding: 14px 16px; margin-bottom: 20px; }
  .headline b { font-size: 20px; display: block; margin-bottom: 2px; }
  .warn { background: #fff7ed; border-left: 5px solid #c2410c; border-radius: 8px; padding: 10px 14px; margin-bottom: 16px; font-size: 15px; }
  section { background: #fff; border-radius: 12px; padding: 16px; margin-bottom: 16px; box-shadow: 0 2px 8px rgba(0, 0, 0, .06); }
  h2 { font-size: 18px; margin: 0 0 10px; }
  table { width: 100%; border-collapse: collapse; }
  caption { text-align: left; font-weight: 700; padding-bottom: 8px; }
  th { text-align: left; font-size: 14px; color: #5b6472; font-weight: 600; border-bottom: 2px solid #e1e4ea; padding: 4px 6px; }
  td { padding: 7px 6px; border-bottom: 1px solid #eef0f4; vertical-align: middle; }
  th.num, td.num { text-align: right; width: 22%; }
  td.share { width: 42%; }
  .cell { display: flex; align-items: center; gap: 8px; }
  .bar { flex: 1; min-width: 30px; height: 12px; background: #eef0f4; border-radius: 6px; overflow: hidden; }
  .bar i { display: block; height: 100%; background: #93c5fd; }
  tr.top td { font-weight: 700; }
  tr.top .bar i { background: #1d4ed8; }
  .pct { width: 38px; text-align: right; font-variant-numeric: tabular-nums; }
  .n { color: #5b6472; font-size: 14px; margin: 8px 0 0; }
  figure { margin: 0 0 14px; }
  blockquote { margin: 0; padding: 10px 14px; border-left: 4px solid #cbd5e1; background: #f8fafc; border-radius: 0 8px 8px 0; font-size: 17px; }
  blockquote p { margin: 0; }
  figcaption { font-size: 14px; color: #5b6472; margin: 4px 0 0 18px; }
  ul.next { margin: 0; padding-left: 20px; }
  .note { font-size: 14px; color: #5b6472; }
  @media print {
    @page { size: A4; margin: 16mm; }
    body { background: #fff; }
    section, figure { break-inside: avoid; box-shadow: none; border: 1px solid #e1e4ea; }
    .bar, .bar i, .headline { print-color-adjust: exact; -webkit-print-color-adjust: exact; }
  }
</style>
</head>
<body>
<main class="page" id="page"></main>

<script>
  // ---- Paste your survey totals here. The page below is built from this block. ----
  const SURVEY = {
    title: 'Team pulse survey: the hybrid schedule',
    org: 'Fernhill Office (a made-up example)',
    period: 'Open 8 to 19 September',
    responses: 41,
    headline: { question: 0, answers: [0, 1], text: 'rated the schedule good or very good' },
    questions: [
      { q: 'How did you find the new hybrid schedule?',
        answers: [['Very good', 14], ['Good', 17], ['Neutral', 6], ['Poor', 3], ['Very poor', 1]] },
      { q: 'Which day do you prefer in the office?',
        answers: [['Tuesday', 12], ['Wednesday', 15], ['Thursday', 9], ['No preference', 5]] },
      { q: 'Would you use a quiet room for calls?',
        answers: [['Yes', 29], ['No', 7], ['Not sure', 5]] }
    ],
    quotes: [
      { text: 'Tuesdays and Wednesdays are when my whole team is in, so meetings finally fit in one day.', who: 'Operations, 2 years' },
      { text: 'I would like one quiet room that nobody books for calls.', who: 'Finance, 5 years' },
      { text: 'Thursday in the office feels empty. I would move my day to Wednesday if I could.', who: 'Support, 1 year' }
    ],
    next: ['Keep Tuesday and Wednesday as the core days.', 'Trial one quiet room from October.', 'Run the survey again in January.']
  };
  // ---- Nothing below needs editing. ----

  const make = (tag, cls, text) => {
    const e = document.createElement(tag);
    if (cls) e.className = cls;
    if (text != null) e.textContent = text;
    return e;
  };
  const sum = (q) => q.answers.reduce((t, a) => t + a[1], 0);
  const pct = (n, total) => Math.round(100 * n / total);

  const page = document.getElementById('page');

  const head = make('header');
  head.append(make('h1', '', SURVEY.title));
  head.append(make('p', 'meta', SURVEY.org + ' | ' + SURVEY.period + ' | ' + SURVEY.responses + ' responses'));
  page.append(head);

  // Headline: the one sentence a reader should take away
  const h = SURVEY.headline;
  const hq = SURVEY.questions[h.question];
  const hn = h.answers.reduce((t, i) => t + hq.answers[i][1], 0);
  const box = make('div', 'headline');
  box.id = 'headline';
  box.append(make('b', '', pct(hn, sum(hq)) + '% ' + h.text));
  box.append(make('span', '', hn + ' of ' + sum(hq) + ' people who answered.'));
  page.append(box);

  // Check that each question adds up to the number of responses
  SURVEY.questions.forEach((q, i) => {
    if (sum(q) !== SURVEY.responses) {
      const w = make('div', 'warn', 'Question ' + (i + 1) + ' adds up to ' + sum(q) + ', but the survey has ' + SURVEY.responses + ' responses. Check for skipped answers or a typo.');
      page.append(w);
    }
  });

  // One summary table per question
  SURVEY.questions.forEach((q, i) => {
    const total = sum(q);
    const top = Math.max(...q.answers.map((a) => a[1]));
    const sec = make('section');
    const t = make('table');
    t.append(make('caption', '', 'Q' + (i + 1) + '. ' + q.q));
    const hr = make('tr');
    ['Answer', 'Responses', 'Share'].forEach((label, k) => {
      const th = make('th', k === 1 ? 'num' : '', label);
      th.scope = 'col';
      hr.append(th);
    });
    const thead = make('thead');
    thead.append(hr);
    t.append(thead);
    const tb = make('tbody');
    q.answers.forEach((a) => {
      const tr = make('tr', a[1] === top ? 'top' : '');
      tr.append(make('td', '', a[0]));
      tr.append(make('td', 'num', String(a[1])));
      const share = make('td', 'share');
      const cell = make('div', 'cell');
      const bar = make('div', 'bar');
      const fill = make('i');
      fill.style.width = pct(a[1], total) + '%';
      bar.append(fill);
      cell.append(bar, make('span', 'pct', pct(a[1], total) + '%'));
      share.append(cell);
      tr.append(share);
      tb.append(tr);
    });
    t.append(tb);
    sec.append(t);
    sec.append(make('p', 'n', 'n = ' + total + '. Shares are rounded, so they may not add to exactly 100.'));
    page.append(sec);
  });

  // Key quotes
  const qs = make('section');
  qs.append(make('h2', '', 'In their words'));
  SURVEY.quotes.forEach((q) => {
    const f = make('figure');
    const b = make('blockquote');
    b.append(make('p', '', q.text));
    f.append(b, make('figcaption', '', q.who));
    qs.append(f);
  });
  qs.append(make('p', 'note', 'Quotes are chosen from the open comments, with names removed.'));
  page.append(qs);

  // What happens next
  const nx = make('section');
  nx.append(make('h2', '', 'What happens next'));
  const ul = make('ul', 'next');
  SURVEY.next.forEach((s) => ul.append(make('li', '', s)));
  nx.append(ul);
  page.append(nx);
</script>
</body>
</html>
What goes on the page, in order
The example follows one order. It is an editorial choice, not a standard. A reader skims, so the first screen should say what people thought and what happens now, before any table.
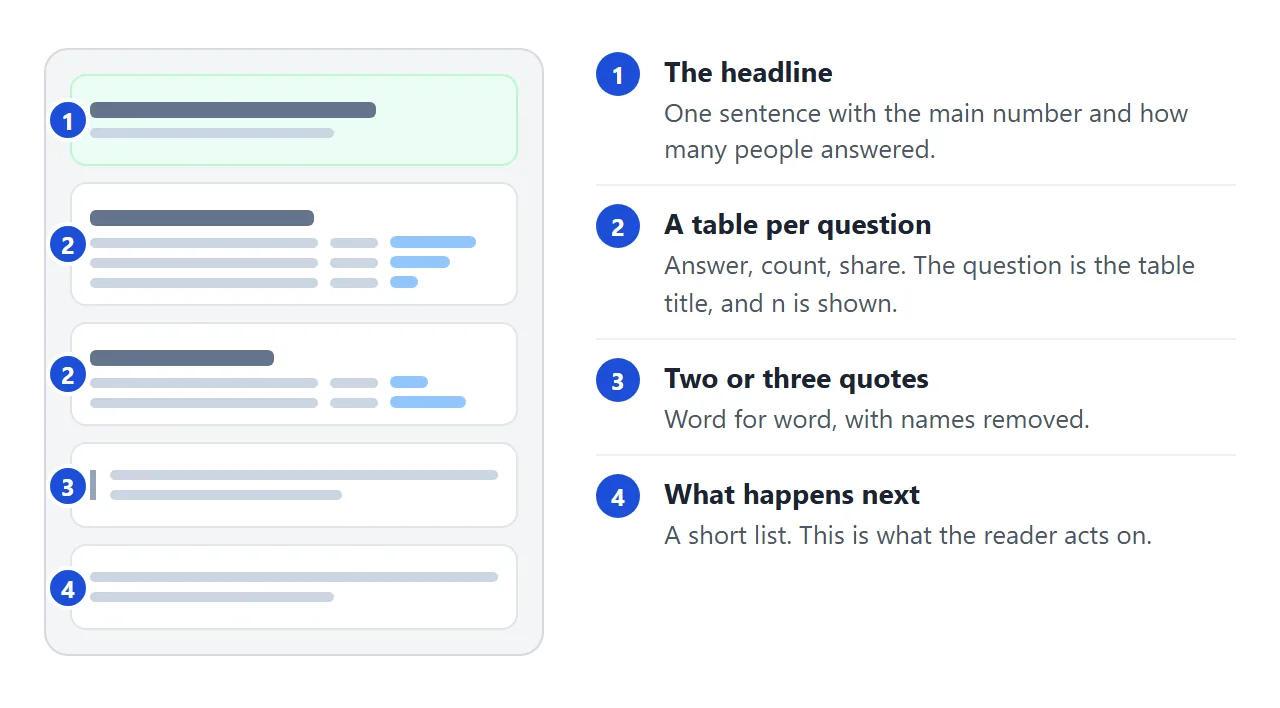
- The headline – one sentence with the main percentage and how many people answered.
- A table per question – the question is the table title, then Answer, Responses and Share, with n underneath.
- Key quotes – two or three, word for word, with names removed.
- What happens next – a short list. This is the part the reader acts on.
The example also adds up each question's counts and shows a warning if they do not match the number of responses. Paste a wrong number and you see it before your reader does.
Choosing the quotes
Pick quotes that explain a number, not the loudest ones. MDN describes the blockquote element as marking extended quotations, and says the attribution belongs outside it. The example puts each quote in a blockquote with a caption below.
Copy each quote exactly as written. Show a role, or nothing. In a small team even a role and years of service can point to one person, so leave them out when that is a risk.
Counts and rounding
Each share is rounded to a whole number, so a table can add to 99 or 101. In the first example, the first question adds to 99 (measured). The page says so under every table.
Make it with AI
Paste this prompt into ChatGPT, Claude or Gemini. Put your own facts at the bottom.
Write ONE self-contained HTML file: a survey results report, to be read on a phone.
Rules:
- Plain HTML, CSS and JavaScript in one file. No images, no external files, no form that sends data.
- One column. Add a viewport meta tag. Text at least 16px.
- Order: a headline sentence with the main percentage and the number of people who answered; one table per question; a Key quotes section; a What happens next list.
- Each table has a caption with the question text, the columns Answer, Responses and Share, and a small bar in the Share column. Show n under it.
- Put all totals, quotes and next steps in one block at the top of the script, with the comment "Paste your totals here". Work out the shares in the script.
- Show a warning if a question's counts do not add up to the number of responses.
- Put each quote in a blockquote with a figcaption, exactly as I give it.
- Add a print style: A4, no grey background, tables and quotes do not split across pages.
- If I did not give you a fact, write TODO. Do not invent counts, quotes or conclusions.
My facts:
Survey title and dates: ...
Number of responses: ...
Question 1 and its answers with counts: ...
Question 2 and its answers with counts: ...
Quotes, with role only: ...
What happens next: ...
The block-of-totals line matters. It turns the next round into one edit instead of a hunt through the page.
What to check in the result
An AI is good at layout and loose with facts. Read the page the way your reader will.
- Every count. Compare each one with your export, and check that the headline percentage matches its table.
- Every quote. Word for word against the original comment.
- Every TODO. Replace it, or delete the line.
- Invented conclusions. A headline claiming more than the numbers show.
- The phone. Open it on your own phone before anyone else does.
The longer version of this check is in the HTML report guide. If the page looks wrong, fixing AI-generated HTML covers the usual causes.
Start from raw rows instead of totals
Some survey tools give you one row per respondent, not totals. The second example takes rows as they are and does the counting. Each row is a team, two scores from 1 to 5 and a comment.
<!doctype html>
<html lang="en">
<head>
<meta charset="utf-8">
<meta name="viewport" content="width=device-width, initial-scale=1">
<title>Survey results from raw rows</title>
<style>
  * { box-sizing: border-box; }
  body { margin: 0; background: #f4f5f7; color: #1d2330; font: 16px/1.5 system-ui, sans-serif; }
  .page { max-width: 720px; margin: 0 auto; padding: 20px 16px 40px; }
  h1 { font-size: 24px; line-height: 1.25; margin: 0 0 4px; }
  .meta { color: #5b6472; font-size: 15px; margin: 0 0 14px; }
  label { font-size: 15px; font-weight: 600; }
  select { font: inherit; padding: 6px 8px; margin-left: 6px; border-radius: 8px; border: 1px solid #cbd5e1; background: #fff; }
  .stats { display: grid; grid-template-columns: repeat(3, 1fr); gap: 10px; margin: 14px 0; }
  .stat { background: #fff; border-radius: 12px; padding: 12px; box-shadow: 0 2px 8px rgba(0, 0, 0, .06); }
  .stat b { display: block; font-size: 26px; line-height: 1.1; }
  .stat span { font-size: 14px; color: #5b6472; }
  section { background: #fff; border-radius: 12px; padding: 16px; margin-bottom: 16px; box-shadow: 0 2px 8px rgba(0, 0, 0, .06); }
  h2 { font-size: 18px; margin: 0 0 10px; }
  table { width: 100%; border-collapse: collapse; }
  caption { text-align: left; font-weight: 700; padding-bottom: 8px; }
  th { text-align: left; font-size: 14px; color: #5b6472; font-weight: 600; border-bottom: 2px solid #e1e4ea; padding: 4px 6px; }
  td { padding: 6px; border-bottom: 1px solid #eef0f4; }
  th.num, td.num { text-align: right; width: 20%; }
  td.share { width: 46%; }
  .cell { display: flex; align-items: center; gap: 8px; }
  .bar { flex: 1; min-width: 30px; height: 12px; background: #eef0f4; border-radius: 6px; overflow: hidden; }
  .bar i { display: block; height: 100%; background: #1d4ed8; }
  .pct { width: 38px; text-align: right; font-variant-numeric: tabular-nums; }
  figure { margin: 0 0 14px; }
  blockquote { margin: 0; padding: 10px 14px; border-left: 4px solid #cbd5e1; background: #f8fafc; border-radius: 0 8px 8px 0; font-size: 17px; }
  blockquote p { margin: 0; }
  figcaption { font-size: 14px; color: #5b6472; margin: 4px 0 0 18px; }
  details { margin-top: 6px; }
  summary { cursor: pointer; font-weight: 600; }
  details li { margin: 6px 0; }
  .empty { color: #5b6472; }
  @media print {
    @page { size: A4; margin: 16mm; }
    body { background: #fff; }
    section, figure, .stat { break-inside: avoid; box-shadow: none; border: 1px solid #e1e4ea; }
    .bar, .bar i { print-color-adjust: exact; -webkit-print-color-adjust: exact; }
  }
</style>
</head>
<body>
<main class="page">
  <h1>New order form: staff feedback</h1>
  <p class="meta">Harbor Lane Co. (a made-up example). Scores run from 1 (strongly disagree) to 5 (strongly agree).</p>
  <label for="team">Show results for <select id="team"></select></label>
  <div class="stats">
    <div class="stat"><b id="s-n">0</b><span>responses</span></div>
    <div class="stat"><b id="s-ease">0</b><span>average: easy to fill in</span></div>
    <div class="stat"><b id="s-clarity">0</b><span>average: instructions clear</span></div>
  </div>
  <div id="tables"></div>
  <section id="quotes"></section>
  <section id="all"></section>
</main>

<script>
  // ---- Paste one row per respondent: team|ease|clarity|comment ----
  // A comment that starts with * becomes a key quote. Leave it empty for no comment.
  const ROWS = `
Sales|4|5|*The new order form saved me a phone call every day.
Sales|5|4|
Sales|3|3|Fine once I found the Save button.
Sales|4|4|
Sales|2|3|Too many fields on the first screen.
Sales|5|5|
Sales|4|3|
Support|3|2|*I could not tell which ticket status meant "waiting on customer".
Support|2|2|Search is slow when the list is long.
Support|4|3|
Support|3|3|
Support|2|3|*Help text uses words we do not use on the floor.
Support|4|4|
Support|3|2|
Ops|5|4|
Ops|4|5|*Clear enough that I trained a new hire in ten minutes.
Ops|4|4|
Ops|3|4|Export to a spreadsheet would help.
Ops|5|5|
Ops|4|4|
`;
  const QUESTIONS = [
    { key: 'ease', label: 'The form was easy to fill in' },
    { key: 'clarity', label: 'The instructions were clear' }
  ];
  // ---- Nothing below needs editing. ----

  const rows = ROWS.trim().split('\n').map((line) => {
    const p = line.split('|');
    return { team: p[0].trim(), ease: Number(p[1]), clarity: Number(p[2]), comment: p.slice(3).join('|').trim() };
  });

  const make = (tag, cls, text) => {
    const e = document.createElement(tag);
    if (cls) e.className = cls;
    if (text != null) e.textContent = text;
    return e;
  };
  const pct = (n, total) => (total ? Math.round(100 * n / total) : 0);
  const mean = (list, key) => (list.length ? (list.reduce((t, r) => t + r[key], 0) / list.length).toFixed(1) : '-');

  const select = document.getElementById('team');
  ['All teams'].concat([...new Set(rows.map((r) => r.team))]).forEach((t) => {
    const o = make('option', '', t);
    o.value = t;
    select.append(o);
  });

  function render() {
    const team = select.value;
    const list = team === 'All teams' ? rows : rows.filter((r) => r.team === team);

    document.getElementById('s-n').textContent = list.length;
    document.getElementById('s-ease').textContent = mean(list, 'ease');
    document.getElementById('s-clarity').textContent = mean(list, 'clarity');

    const tables = document.getElementById('tables');
    tables.replaceChildren();
    QUESTIONS.forEach((q) => {
      const sec = make('section');
      const t = make('table');
      t.append(make('caption', '', q.label + ' (n = ' + list.length + ')'));
      const hr = make('tr');
      ['Score', 'Responses', 'Share'].forEach((label, k) => {
        const th = make('th', k === 1 ? 'num' : '', label);
        th.scope = 'col';
        hr.append(th);
      });
      const thead = make('thead');
      thead.append(hr);
      t.append(thead);
      const tb = make('tbody');
      [5, 4, 3, 2, 1].forEach((score) => {
        const n = list.filter((r) => r[q.key] === score).length;
        const tr = make('tr');
        tr.append(make('td', '', String(score)));
        tr.append(make('td', 'num', String(n)));
        const share = make('td', 'share');
        const cell = make('div', 'cell');
        const bar = make('div', 'bar');
        const fill = make('i');
        fill.style.width = pct(n, list.length) + '%';
        bar.append(fill);
        cell.append(bar, make('span', 'pct', pct(n, list.length) + '%'));
        share.append(cell);
        tr.append(share);
        tb.append(tr);
      });
      t.append(tb);
      sec.append(t);
      tables.append(sec);
    });

    // Key quotes: comments that start with *
    const quotes = document.getElementById('quotes');
    quotes.replaceChildren(make('h2', '', 'Key quotes'));
    const keys = list.filter((r) => r.comment.startsWith('*'));
    if (!keys.length) quotes.append(make('p', 'empty', 'No key quotes for this group.'));
    keys.forEach((r) => {
      const f = make('figure');
      const b = make('blockquote');
      b.append(make('p', '', r.comment.slice(1).trim()));
      f.append(b, make('figcaption', '', r.team + ' team'));
      quotes.append(f);
    });

    // Every other comment, folded away
    const all = document.getElementById('all');
    all.replaceChildren();
    const others = list.filter((r) => r.comment && !r.comment.startsWith('*'));
    const d = make('details');
    d.append(make('summary', '', 'Other comments (' + others.length + ')'));
    const ul = make('ul');
    others.forEach((r) => ul.append(make('li', '', r.comment + ' (' + r.team + ')')));
    d.append(ul);
    all.append(d);
  }

  select.addEventListener('change', render);
  render();
</script>
</body>
</html>
Choose Support in the menu and the averages fall to 3.0 and 2.7 (measured). The count under each table changes too, so the reader sees how many people sit behind a number.
An average treats the scores as evenly spaced, so the example also shows how many people gave each score. That lets the reader see the spread. For turning a spreadsheet into a table, see HTML table from CSV.
Be careful with the filter on small groups. A table built from three people can point to them.
Send it as a link
Paste the HTML into a NOS document and choose Create share link. HTML to link walks through it.
The result is a page anyone with the link can open in a browser, on a phone too, with no account. They can read it but not edit it.
Because anyone with the link can open it, send it only to the people who should see the results.
Put the address in the body of your email or message, with one line saying which survey and which dates it covers.
Next round: open the page in NOS, change the totals and quotes in the block at the top of the script, and save. The same link shows the new version. To keep each round, make a new page and a new link per round.
Screenshot, file or page: how they compare
| Screenshot | PDF attached | Spreadsheet attached | Page as a link | |
|---|---|---|---|---|
| Layout on a phone | Fixed picture | Fixed page size | Needs a spreadsheet app | Fits the screen |
| Reader can copy a number | No | Usually | Yes | Yes |
| Shows rows you meant to keep private | No | No | Yes, every row you attach | No, only what is on the page |
| Fix after sending | New picture | New file | New file | Edit the page, same link |
| Needs an account to read | No | No | No | No |
For personal Gmail accounts, Google's help page says the attachment limit is 25 MB, and Gmail adds a larger file as a Drive link instead (as of October 2026).
A results page is far below that, so size is rarely the issue. The issue is what happens when you correct a count after sending. See email vs link for documents.
If someone wants it on paper
Both examples carry a print style, so the pages print cleanly from the browser. break-inside: avoid asks the browser not to split a table or a quote across two pages, according to MDN.
@media print {
  @page { size: A4; margin: 16mm; }
  section, figure { break-inside: avoid; }
}
Use letter instead of A4 for North American paper, and check the print preview before you send anything. Print stylesheets covers more.
When it does not work
| What you see | Cause | Fix |
|---|---|---|
| The shares add to 99 or 101 | Each share is rounded on its own | Keep the note under the table, or ask for one decimal place |
| A warning says the counts do not add up | A typo, or some people skipped the question | Compare with your export, or explain the gap in the page |
| The page shows raw code in the chat | You copied the chat text, not the code block | Copy only the code, from the doctype line to the last html tag |
| A logo or chart image is missing | Images from other sites are blocked | Ask for no images, or a logo drawn in SVG |
| The table runs off the side of a phone | Too many columns | One table per question with three columns |
| A feedback form does nothing | Forms cannot send to a server from the link | Write your email address as plain text |
| The reader sees last round's results | They opened an old file or an old link | Send only the link, never the file |
| The text is tiny on a phone | No viewport meta tag | Ask the AI to add one, and a 16px base size |
Related reading. If you are still collecting answers, a survey link covers sharing the form itself. For the bigger picture of results going to a client or a boss, see turning a report into a link.