A take home assignment is a task you finish on your own time and send back. One data analyst describes a case study where "I had less than 24 hours to send back a presentation."
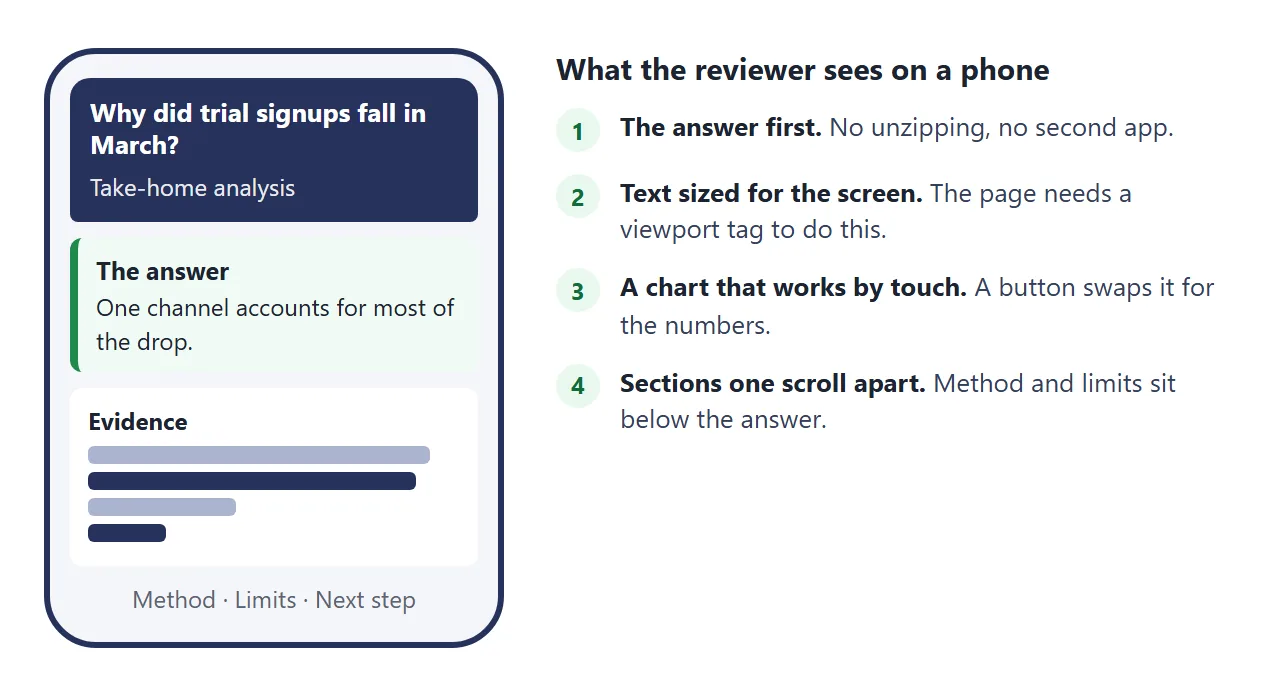
If no format is given, one readable web page sent as one link puts your answer in front of the reviewer first.
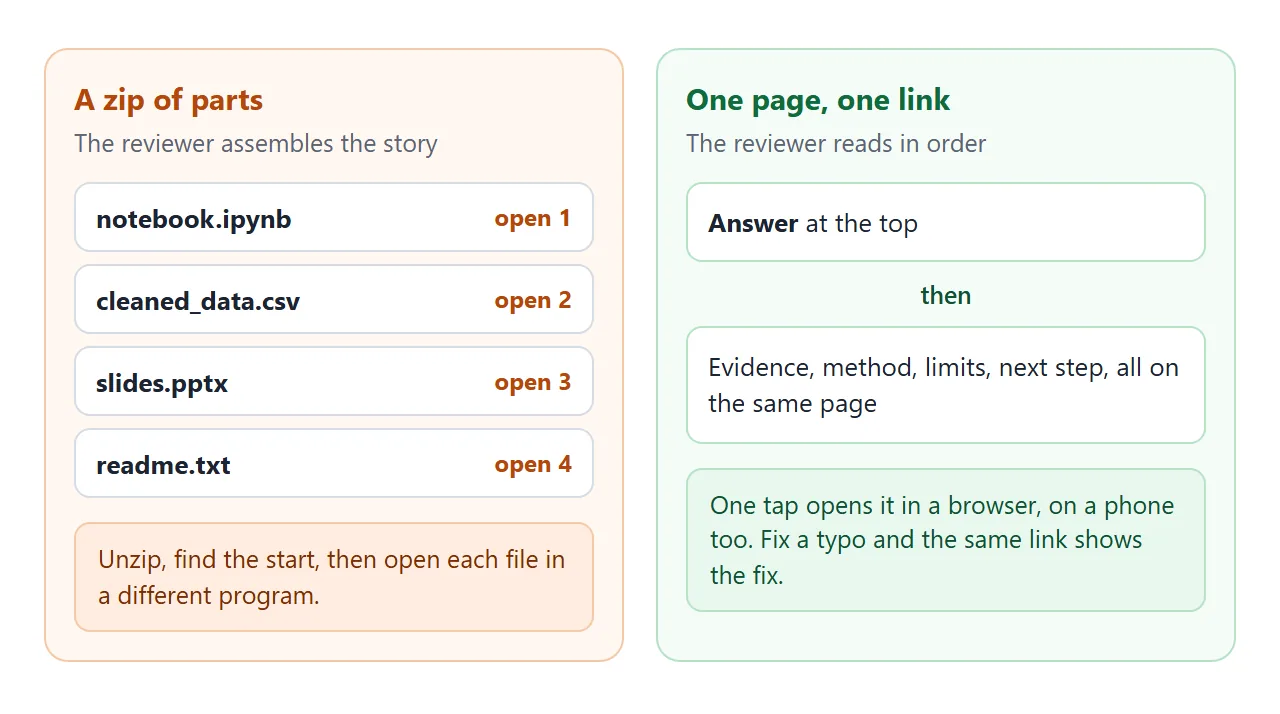
A zip of a notebook, a CSV and slides makes the reviewer open several files before they reach your conclusion. A page holds the answer, the evidence, the method and the limits in the order you want them read. Here is one to copy.
<!doctype html>
<html lang="en">
<head>
<meta charset="utf-8">
<meta name="viewport" content="width=device-width, initial-scale=1">
<title>Take-home: March signup drop</title>
<style>
* { box-sizing: border-box; }
html { scroll-behavior: smooth; }
body { margin: 0; font-family: system-ui, sans-serif; background: #f4f5f8; color: #1d2330; line-height: 1.5; }
header { background: #26325b; color: #fff; padding: 22px 16px 18px; }
header .in, main, nav .in { max-width: 720px; margin: 0 auto; }
header h1 { margin: 0 0 4px; font-size: 23px; line-height: 1.25; }
header p { margin: 0; font-size: 13.5px; opacity: .9; }
nav { position: sticky; top: 0; z-index: 5; background: #fff; border-bottom: 1px solid #dde1ea; }
nav .in { display: flex; gap: 2px; overflow-x: auto; padding: 0 8px; }
nav a { flex: none; padding: 12px 11px; font-size: 14px; font-weight: 600; color: #26325b; text-decoration: none; border-bottom: 3px solid transparent; }
nav a:hover { border-bottom-color: #26325b; }
main { padding: 16px; }
section { background: #fff; border-radius: 12px; padding: 16px; margin-bottom: 14px; box-shadow: 0 1px 6px rgba(0,0,0,.06); scroll-margin-top: 58px; }
h2 { margin: 0 0 8px; font-size: 18px; }
p { margin: 0 0 8px; font-size: 14.5px; }
.answer { border-left: 5px solid #1f8a4c; background: #f1faf4; }
.answer .big { font-size: 17px; font-weight: 700; margin-bottom: 6px; }
.kpis { display: grid; grid-template-columns: repeat(3, 1fr); gap: 8px; margin-top: 10px; }
.kpi { background: #fff; border: 1px solid #cfe8d9; border-radius: 10px; padding: 8px 10px; }
.kpi b { display: block; font-size: 20px; }
.kpi span { font-size: 12px; color: #4a5568; }
.row { display: grid; grid-template-columns: 110px 1fr 56px; gap: 8px; align-items: center; margin: 8px 0; font-size: 13.5px; }
.tracks { display: flex; flex-direction: column; gap: 3px; }
.t { height: 12px; border-radius: 4px; }
.t.feb { background: #aab4cf; }
.t.mar { background: #26325b; }
.chg { font-weight: 700; text-align: right; }
.neg { color: #b4470c; }
.flat { color: #5b6472; }
.key { display: flex; gap: 14px; font-size: 12.5px; color: #4a5568; margin: 2px 0 6px; }
.key i { display: inline-block; width: 12px; height: 12px; border-radius: 3px; margin-right: 5px; vertical-align: -1px; }
button { font: inherit; font-size: 13.5px; font-weight: 600; padding: 7px 12px; border: 1px solid #26325b; background: #fff; color: #26325b; border-radius: 8px; cursor: pointer; margin-top: 6px; }
button:hover { background: #26325b; color: #fff; }
table { width: 100%; border-collapse: collapse; font-size: 14px; }
th, td { text-align: left; padding: 7px 6px; border-bottom: 1px solid #e6e9f0; }
th { font-size: 12px; color: #5b6472; text-transform: uppercase; letter-spacing: .03em; }
td.n, th.n { text-align: right; }
details { border-top: 1px solid #e6e9f0; padding: 9px 0; }
details:first-of-type { border-top: 0; }
summary { cursor: pointer; font-weight: 700; font-size: 15px; }
details p { margin: 6px 0 2px; }
ol, ul { margin: 0; padding-left: 20px; font-size: 14.5px; }
li { margin-bottom: 4px; }
.tag { display: inline-block; padding: 1px 8px; border-radius: 999px; background: #ffe9a8; color: #6b4a00; font-size: 12px; font-weight: 700; }
footer { text-align: center; font-size: 13px; color: #5b6472; padding: 4px 16px 22px; }
[hidden] { display: none !important; }
@media (max-width: 480px) { .row { grid-template-columns: 84px 1fr 48px; font-size: 13px; } .kpi b { font-size: 17px; } header h1 { font-size: 20px; } }
</style>
</head>
<body>
<header><div class="in">
<h1>Why did trial signups fall in March?</h1>
<p>Take-home analysis for Brightloaf Bakery Club (fictional) · Sample data · Written by Sam Rivera (fictional)</p>
</div></header>
<nav><div class="in">
<a href="#answer">Answer</a><a href="#evidence">Evidence</a><a href="#method">Method</a><a href="#limits">Limits</a><a href="#next">Next step</a>
</div></nav>
<main>
<section id="answer" class="answer">
<h2>The answer</h2>
<p class="big" id="headline"></p>
<p>The drop is concentrated in one channel, and its timing matches a change to the referral reward on 3 March. I treat that as the leading explanation, not as proven.</p>
<div class="kpis" id="kpis"></div>
</section>
<section id="evidence">
<h2>Evidence: signups per week by channel</h2>
<p>Average of four weeks in February against four weeks in March.</p>
<div id="chart">
<div class="key"><span><i style="background:#aab4cf"></i>February</span><span><i style="background:#26325b"></i>March</span></div>
<div id="bars"></div>
</div>
<div id="tablewrap" hidden>
<table>
<thead><tr><th>Channel</th><th class="n">Feb</th><th class="n">Mar</th><th class="n">Change</th></tr></thead>
<tbody id="rows"></tbody>
</table>
</div>
<button id="toggle" type="button" aria-pressed="false">Show the numbers</button>
</section>
<section id="method">
<h2>How I got there</h2>
<details open><summary>1. Cleaned the export</summary><p>Removed 14 duplicate rows and 3 test accounts. Kept every other row, including partial weeks.</p></details>
<details><summary>2. Split signups by channel</summary><p>Used the channel field as given. Rows with an empty channel were counted as Organic.</p></details>
<details><summary>3. Compared equal periods</summary><p>Four full weeks against four full weeks, so a short month does not look like a drop.</p></details>
<details><summary>4. Checked the timing</summary><p>Daily referral signups fell on 3 March, the day the reward changed from a free box to 10% off.</p></details>
</section>
<section id="limits">
<h2>What could make me wrong</h2>
<ul>
<li><span class="tag">Assumption</span> The empty-channel rows really are Organic.</li>
<li><span class="tag">Gap</span> Two months of data cannot rule out a seasonal dip.</li>
<li><span class="tag">Gap</span> I had no data on what the reward email said.</li>
</ul>
</section>
<section id="next">
<h2>What I would do next</h2>
<ol>
<li>Offer the old reward to half of new referrers for two weeks.</li>
<li>Compare referral signups between the two halves.</li>
<li>Keep the cheaper reward only if the gap is small.</li>
</ol>
</section>
</main>
<footer>About 6 hours of work. All figures in this page are sample data.</footer>
<script>
// Edit these numbers and the headline, chart and table all update.
const DATA = [
{ channel: 'Search ads', feb: 420, mar: 410 },
{ channel: 'Email referral', feb: 180, mar: 95 },
{ channel: 'Organic', feb: 260, mar: 250 },
{ channel: 'Partners', feb: 140, mar: 135 }
];
const sum = (k) => DATA.reduce((t, d) => t + d[k], 0);
const febTotal = sum('feb'), marTotal = sum('mar');
const drop = febTotal - marTotal;
const worst = DATA.reduce((a, b) => (b.feb - b.mar > a.feb - a.mar ? b : a));
const share = Math.round(((worst.feb - worst.mar) / drop) * 100);
const pct = (a, b) => Math.round(((b - a) / a) * 100);
const max = Math.max(...DATA.map((d) => Math.max(d.feb, d.mar)));
document.getElementById('headline').textContent =
worst.channel + ' accounts for ' + share + '% of the drop in weekly signups.';
const kpis = [
[pct(febTotal, marTotal) + '%', 'weekly signups, total'],
[pct(worst.feb, worst.mar) + '%', worst.channel + ' signups'],
[share + '%', 'of the drop is this channel']
];
document.getElementById('kpis').innerHTML = kpis
.map((k) => '<div class="kpi"><b>' + k[0] + '</b><span>' + k[1] + '</span></div>').join('');
const bars = document.getElementById('bars');
const rows = document.getElementById('rows');
DATA.forEach((d) => {
const c = pct(d.feb, d.mar);
const cls = c <= -10 ? 'neg' : 'flat';
const row = document.createElement('div');
row.className = 'row';
row.innerHTML = '<span>' + d.channel + '</span>' +
'<div class="tracks"><div class="t feb" style="width:' + (d.feb / max * 100) + '%"></div>' +
'<div class="t mar" style="width:' + (d.mar / max * 100) + '%"></div></div>' +
'<span class="chg ' + cls + '">' + c + '%</span>';
bars.appendChild(row);
const tr = document.createElement('tr');
tr.innerHTML = '<td>' + d.channel + '</td><td class="n">' + d.feb + '</td><td class="n">' + d.mar +
'</td><td class="n ' + cls + '">' + c + '%</td>';
rows.appendChild(tr);
});
const toggle = document.getElementById('toggle');
toggle.addEventListener('click', () => {
const showTable = document.getElementById('tablewrap').hidden;
document.getElementById('tablewrap').hidden = !showTable;
document.getElementById('chart').hidden = showTable;
toggle.textContent = showTable ? 'Show the chart' : 'Show the numbers';
toggle.setAttribute('aria-pressed', String(showTable));
});
</script>
</body>
</html>
Press the button under the chart. Because scripts run on a shared page, the reviewer can do the same. Change the four rows of numbers in the script and the headline, chart and table all follow.
Make it with AI
Open ChatGPT, Claude or Gemini and paste the prompt below. Replace the lines at the end with your own work. The key rule is in the prompt: the AI may use only the numbers you give it.
Write one self-contained HTML page for my take-home assignment.
Sections in this order: The answer (one sentence and three key numbers), Evidence, How I got there, What could make me wrong, What I would do next.
Use only the facts and numbers I paste below. Do not invent any number, name or source.
Put the CSS and JavaScript inside the same file. No outside images, fonts or libraries.
Make it readable on a phone and on a laptop.
Show the main result as a chart built with HTML and CSS, and add a button that swaps it for a table of the exact numbers.
Reply with the HTML only.

The task I was given:
My answer:
My numbers (exact):
My method steps:
My assumptions and limits:
When the page comes back, read it before you send it:
- Numbers. Compare every figure with your notebook or spreadsheet, not with the chat. Look for rounding, swapped values and numbers you never gave.
- The answer. It should be visible without scrolling. If the AI buried it under an introduction, ask for it on top.
- Claims. The page must not say more than your work shows. Keep the word "suggests" where the data only suggests.
- Rules. Check the assignment for rules on AI tools and on sharing company data.
What goes on the page
Give each section one question to answer for the reviewer. If a sentence does not help answer it, cut it.
| Section | The reviewer's question | Keep it to |
|---|---|---|
| The answer | What did you conclude? | One sentence and up to three numbers |
| Evidence | How do I know you are right? | One chart and a table behind it |
| How I got there | What did you do with the data? | Short numbered steps |
| What could make me wrong | Do you know your limits? | Assumptions and gaps, in plain words |
| What I would do next | What would you do with more time? | Two or three steps |
Writing the limits yourself shows judgment, and it saves the reviewer from finding them. For the chart itself, HTML bar chart shows how one is built.
Send it as a link
Copy the HTML, paste it into a NOS document and choose Create share link. HTML to link walks through it. The page renders as written and its scripts run.
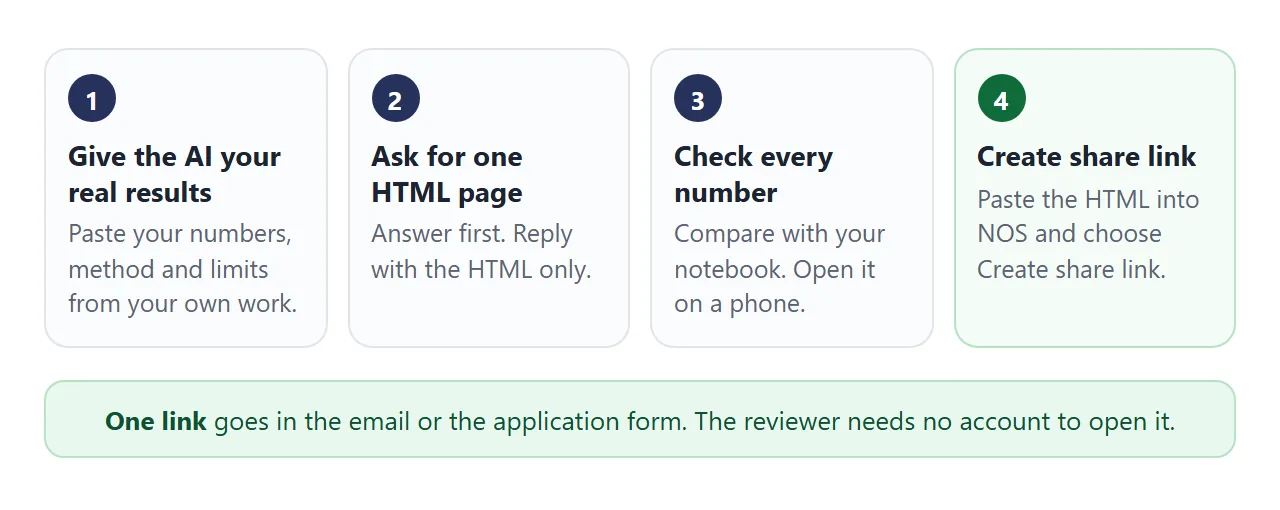
Whoever opens the link sees the page in their browser, on a phone too, with no account. They cannot edit it. If you fix a typo, change the code and the same link shows the new version.
That works against you after the deadline: a reviewer who opens the link again sees your latest version. Treat the deadline as the moment you stop editing.
To put the link where the reviewer will look:
- Gmail (as of October 2026). In a message on a computer, highlight text, click Insert (or press Ctrl + K), paste the URL, and click Apply.
- An application portal. If it only accepts a file, upload what it asks for and put the link in your message or on the first page of the file.
- Your CV. Add it next to your other work, as in Case study link.
Ways to send a take home compared
The same write-up can reach the reviewer in several ways. Which fits depends on where your work already lives.
| Way to send | What the reviewer does | Worth knowing (as of October 2026) |
|---|---|---|
| Zip attachment | Downloads, unzips, opens each file | Gmail allows 25 MB per message on a personal account; a Workspace administrator sets the limit on work and school accounts |
| Notion HTML export | Downloads a zip with an HTML version of the page | Notion exports as a zip file |
| Notion published page | Opens a notion.site address | Anyone on the web can view a published page; an Enterprise workspace owner can switch publishing off |
| NOS share link | Opens it in a browser | No account, cannot edit, same link after edits |
If the write-up already lives in Notion, publishing it is a fair route. A page of your own layout fits when you want the answer, the chart and the limits arranged your way.
A zip is covered in opening an HTML zip file, and a link instead of an attachment explains the email side.
Check it before you send
Run through the list on the page itself, not in the AI chat. It takes five minutes. The message at the bottom updates as you type.
<!doctype html>
<html lang="en">
<head>
<meta charset="utf-8">
<meta name="viewport" content="width=device-width, initial-scale=1">
<title>Before you send the link</title>
<style>
  * { box-sizing: border-box; }
  body { margin: 0; padding: 16px; font-family: system-ui, sans-serif; background: #f4f5f8; color: #1d2330; line-height: 1.5; }
  .wrap { max-width: 640px; margin: 0 auto; }
  h1 { margin: 0 0 4px; font-size: 21px; }
  .sub { margin: 0 0 14px; font-size: 14px; color: #5b6472; }
  .card { background: #fff; border-radius: 12px; padding: 14px 16px; margin-bottom: 14px; box-shadow: 0 1px 6px rgba(0,0,0,.06); }
  h2 { margin: 0 0 8px; font-size: 16px; }
  .bar { height: 10px; background: #e3e7ef; border-radius: 6px; overflow: hidden; margin: 6px 0 4px; }
  .fill { height: 100%; width: 0; background: #1f8a4c; transition: width .2s; }
  .count { font-size: 13px; color: #5b6472; }
  label.chk { display: flex; gap: 10px; align-items: flex-start; padding: 9px 0; border-top: 1px solid #e6e9f0; font-size: 14.5px; cursor: pointer; }
  label.chk:first-of-type { border-top: 0; }
  label.chk input { margin-top: 4px; width: 18px; height: 18px; flex: none; }
  label.chk small { display: block; color: #5b6472; font-size: 13px; }
  label.chk input:checked + span { color: #0f6b3a; }
  .field { display: block; margin-bottom: 10px; font-size: 13px; font-weight: 600; color: #4a5568; }
  .field input { display: block; width: 100%; margin-top: 3px; padding: 8px 10px; font: inherit; font-size: 15px; border: 1px solid #c9cfdb; border-radius: 8px; }
  textarea { width: 100%; height: 190px; padding: 10px; font: inherit; font-size: 14px; border: 1px solid #c9cfdb; border-radius: 8px; resize: vertical; }
  button { font: inherit; font-size: 14px; font-weight: 600; padding: 8px 14px; border: 1px solid #26325b; background: #26325b; color: #fff; border-radius: 8px; cursor: pointer; margin-top: 8px; }
  #copyNote { margin-left: 10px; font-size: 13px; color: #0f6b3a; }
</style>
</head>
<body>
<div class="wrap">
  <h1>Before you send the link</h1>
  <p class="sub">Six checks, then a short message to go with the link.</p>

  <div class="card">
    <h2>Check the page</h2>
    <div class="bar"><div class="fill" id="fill"></div></div>
    <div class="count" id="count">0 of 6 done</div>
    <div id="list">
      <label class="chk"><input type="checkbox"><span>The answer is in the first screen<small>A reviewer should know your conclusion before scrolling.</small></span></label>
      <label class="chk"><input type="checkbox"><span>Every number matches your own work<small>Compare each figure with your notebook or spreadsheet, not with the AI chat.</small></span></label>
      <label class="chk"><input type="checkbox"><span>Assumptions and limits are written down<small>Say what you assumed and what could make you wrong.</small></span></label>
      <label class="chk"><input type="checkbox"><span>It opens on a phone and the text is readable<small>Open the link on your own phone, then scroll to the end.</small></span></label>
      <label class="chk"><input type="checkbox"><span>It follows the format the assignment asked for<small>If they asked for a file or a portal upload, do that and add the link.</small></span></label>
      <label class="chk"><input type="checkbox"><span>It contains nothing you were told to keep private<small>Anyone who has the link can open the page. Leave out raw company data if asked.</small></span></label>
    </div>
  </div>

  <div class="card">
    <h2>Write the message</h2>
    <label class="field">Role you applied for<input id="role" value="Data Analyst"></label>
    <label class="field">Recipient first name<input id="who" value="Jordan"></label>
    <label class="field">Your link<input id="link" value="https://example.com/your-link"></label>
    <label class="field">Hours you spent<input id="hours" value="6"></label>
    <textarea id="msg" readonly></textarea>
    <button id="copy" type="button">Copy message</button><span id="copyNote"></span>
  </div>
</div>

<script>
  const boxes = document.querySelectorAll('#list input');
  const fill = document.getElementById('fill');
  const count = document.getElementById('count');
  function progress() {
    const done = [...boxes].filter((b) => b.checked).length;
    fill.style.width = (done / boxes.length * 100) + '%';
    count.textContent = done + ' of ' + boxes.length + ' done';
  }
  boxes.forEach((b) => b.addEventListener('change', progress));

  const ids = ['role', 'who', 'link', 'hours'];
  const msg = document.getElementById('msg');
  function build() {
    const v = Object.fromEntries(ids.map((i) => [i, document.getElementById(i).value.trim()]));
    msg.value =
      'Hi ' + v.who + ',\n\n' +
      'Here is my take-home assignment for the ' + v.role + ' role, as one page:\n' + v.link + '\n\n' +
      'The answer is at the top, and the method and the limits are below it. It opens in a browser, on a phone too. ' +
      'I spent about ' + v.hours + ' hours on it.\n\n' +
      'If you would rather have it in another format, tell me and I will send it.\n\nThank you,';
  }
  ids.forEach((i) => document.getElementById(i).addEventListener('input', build));
  build();

  document.getElementById('copy').addEventListener('click', () => {
    msg.select();
    const note = document.getElementById('copyNote');
    const ok = () => { note.textContent = 'Copied'; };
    const fail = () => { note.textContent = 'Selected: press Ctrl + C'; };
    if (navigator.clipboard && navigator.clipboard.writeText) {
      navigator.clipboard.writeText(msg.value).then(ok, fail);
    } else {
      fail();
    }
  });
</script>
</body>
</html>
Open the link on your own phone before you send it. If the text is tiny, see the viewport meta tag. For how phones treat HTML files you attach, see opening an HTML file on a phone.
When it does not work
| What you see | Cause | Fix |
|---|---|---|
| A number differs from your notebook | The AI rounded or invented it | Paste the exact numbers again and ask for a redo |
| Pictures show as empty boxes | Images from other websites are blocked | Ask for inline SVG or CSS shapes |
| An embedded dashboard is blank | Iframes are blocked on the shared page | Describe the finding in text and a table |
| A chart that loads live data stays empty | Requests to other sites are blocked | Paste the numbers into the page itself |
| A submit form does nothing | Sending a form to a server is blocked | Show your email address as plain text |
| Plain text, no colors | The CSS lives in a separate file | Ask for one file with the CSS inside |
| Text is tiny on a phone | The viewport meta tag is missing | Ask the AI to add it, then reopen on the phone |
| The portal accepts only a file | Submission rules differ | Upload the file and put the link in your message |