To turn a CSV into a dashboard without a reporting tool, cut the file down to the rows that matter, paste them into an AI chat, and ask for one HTML page. Then send that page as a link.
The last step is where it usually stalls. One post on X puts it plainly: "A lot of my output from Claude is in HTML. But is surprisingly awkward to share HTML files."
Here is the kind of page you get back. The numbers sit in a small list at the top of the code, so you can change them and watch the cards, bars and table follow.
<!doctype html>
<html lang="en">
<head>
<meta charset="utf-8">
<meta name="viewport" content="width=device-width, initial-scale=1">
<title>Harbor Street Cafe - sales dashboard</title>
<style>
  * { box-sizing: border-box; }
  body { margin: 0; padding: 18px; font-family: system-ui, sans-serif; background: #f4f5f7; color: #1d2330; }
  .wrap { max-width: 760px; margin: 0 auto; }
  h1 { font-size: 20px; margin: 0 0 2px; }
  .when { margin: 0 0 14px; font-size: 13px; color: #5b6475; }
  .cards { display: grid; grid-template-columns: repeat(auto-fit, minmax(170px, 1fr)); gap: 10px; margin-bottom: 14px; }
  .card, .panel { background: #fff; border-radius: 12px; padding: 14px 16px; box-shadow: 0 1px 3px rgba(0, 0, 0, .08); }
  .label { font-size: 12px; color: #5b6475; }
  .value { font-size: 26px; font-weight: 700; font-variant-numeric: tabular-nums; margin-top: 2px; }
  .note { font-size: 12px; margin-top: 2px; }
  .up { color: #0f6b3d; } .down { color: #a2410d; }
  h2 { font-size: 14px; margin: 0 0 10px; }
  .bars { display: grid; gap: 8px; }
  .bar { display: grid; grid-template-columns: 34px 1fr 64px; align-items: center; gap: 8px; font-size: 13px; }
  .track { background: #e9ecf1; border-radius: 4px; height: 18px; }
  .fill { height: 100%; border-radius: 4px; background: #9db6dc; }
  .bar.last .fill { background: #1f5fbf; }
  .num { text-align: right; font-variant-numeric: tabular-nums; }
  table { width: 100%; border-collapse: collapse; margin-top: 14px; font-size: 13px; }
  th, td { padding: 6px 4px; border-bottom: 1px solid #e9ecf1; text-align: left; }
  th.num, td.num { text-align: right; }
</style>
</head>
<body>
<div class="wrap">
  <h1>Harbor Street Cafe: sales</h1>
  <p class="when">Figures through September 2026. Sample data for a fictional cafe.</p>

  <div class="cards" id="cards"></div>

  <div class="panel">
    <h2>Sales by month</h2>
    <div class="bars" id="bars"></div>
    <table>
      <thead><tr><th>Month</th><th class="num">Sales</th><th class="num">Orders</th><th class="num">Per order</th></tr></thead>
      <tbody id="rows"></tbody>
    </table>
  </div>
</div>

<script>
  // The key rows you pasted into the AI chat: month, sales, orders
  const data = [
    ['Apr', 18400, 1210],
    ['May', 20150, 1302],
    ['Jun', 22900, 1415],
    ['Jul', 24800, 1530],
    ['Aug', 23700, 1498],
    ['Sep', 26100, 1612]
  ];

  const money = (n) => '$' + n.toLocaleString('en-US');
  const total = data.reduce((s, r) => s + r[1], 0);
  const last = data[data.length - 1], prev = data[data.length - 2];
  const change = (last[1] - prev[1]) / prev[1] * 100;
  const best = data.reduce((a, b) => (b[1] > a[1] ? b : a));
  const max = best[1];

  function card(label, value, note, cls) {
    return '<div class="card"><div class="label">' + label + '</div><div class="value">' + value +
      '</div><div class="note ' + (cls || '') + '">' + note + '</div></div>';
  }

  document.getElementById('cards').innerHTML =
    card('Total, Apr-Sep', money(total), data.length + ' months') +
    card(last[0] + ' sales', money(last[1]), (change >= 0 ? 'up ' : 'down ') + Math.abs(change).toFixed(1) + '% on ' + prev[0], change >= 0 ? 'up' : 'down') +
    card('Best month', best[0], money(best[1]));

  document.getElementById('bars').innerHTML = data.map((r, i) =>
    '<div class="bar' + (i === data.length - 1 ? ' last' : '') + '"><span>' + r[0] +
    '</span><div class="track"><div class="fill" style="width:' + (r[1] / max * 100).toFixed(1) +
    '%"></div></div><span class="num">' + money(r[1]) + '</span></div>').join('');

  document.getElementById('rows').innerHTML = data.map((r) =>
    '<tr><td>' + r[0] + '</td><td class="num">' + money(r[1]) + '</td><td class="num">' + r[2].toLocaleString('en-US') +
    '</td><td class="num">$' + (r[1] / r[2]).toFixed(2) + '</td></tr>').join('');
</script>
</body>
</html>
The sample is a fictional cafe. Your own page would hold your figures, but the shape is the same: a date line, a few headline numbers, one chart and a table.
Pick the key rows, not the whole file
A CSV export can run to thousands of rows. A dashboard needs the answer, not the log. Before you open the AI chat, decide what the reader should see, and work out those numbers in a spreadsheet.
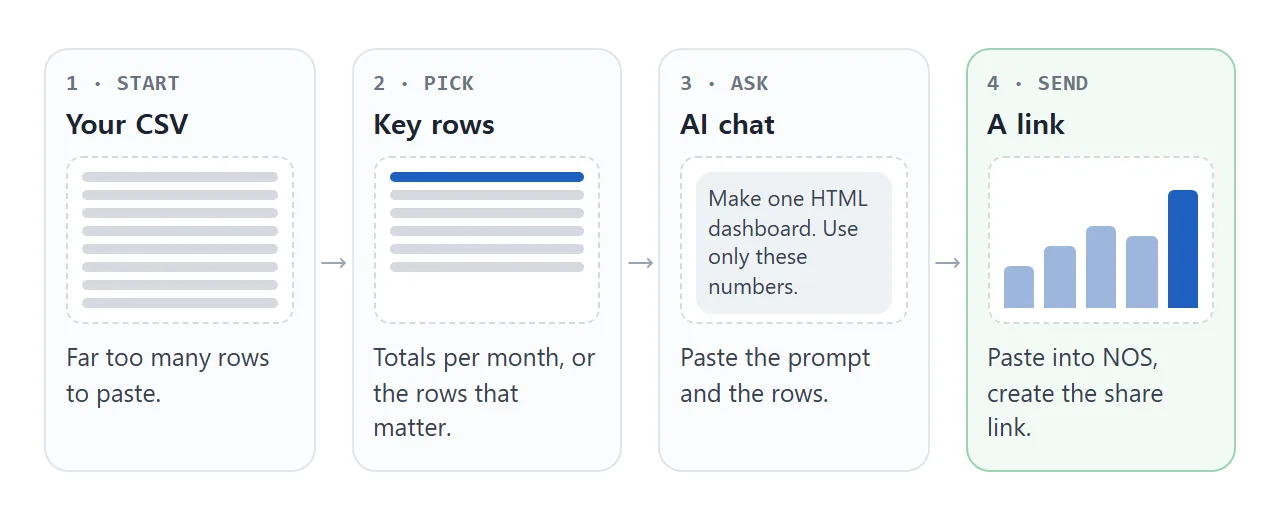
Good key rows are usually one of three things:
- Totals per period or category, such as sales by month or tickets by team.
- The top and bottom few rows, such as the five best and five worst products.
- The latest period beside the one before it, so the page can show the change.
If the file will not open cleanly, start with how to open a CSV file correctly. To work out the totals in Google Sheets, see CSV to Google Sheets.
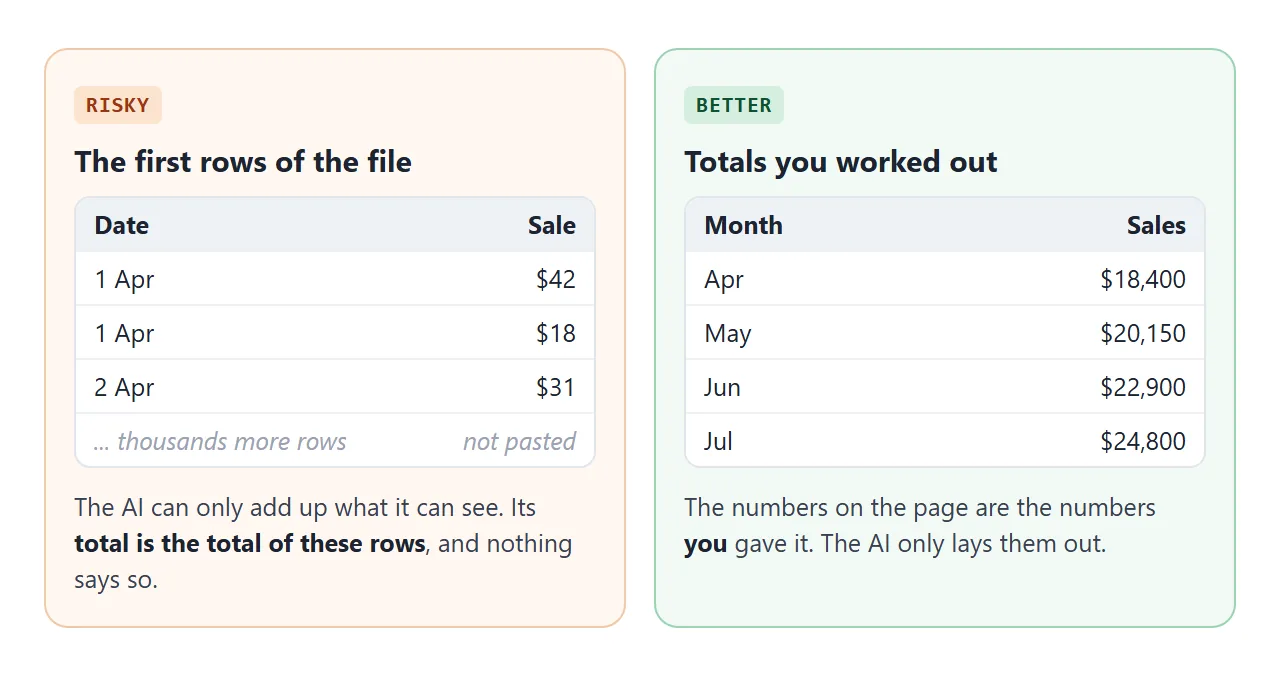
Do not paste only the first rows of a large file and call it a summary. The AI adds up what it can see, so the total on the page is the total of those rows.
Make it with AI
Paste this into ChatGPT, Claude or Gemini, then add your rows under it. Change the name and the columns to match your data.
Make one self-contained HTML page: a sales dashboard for
"Harbor Street Cafe", figures through September 2026.
Top: a line saying what period the figures cover, then three
stat cards (total, latest month with change vs the month before,
best month). Below: a bar chart of sales by month built with
divs or inline SVG, and a table with Month, Sales, Orders.
Use only the rows below. Do not add, round or estimate any number.
If something is missing, write TODO.
No external images, fonts or scripts. Add a viewport meta tag.
Stack the cards in one column on a phone.

Month, Sales, Orders
Apr, 18400, 1210
May, 20150, 1302
Jun, 22900, 1415
Before you use the result, check three things.
- Every number comes from your rows. Add up the total yourself and recompute any percentage. AI can round a figure or fill a gap with a plausible one.
- The labels say what the numbers are. A card that says "Sales" should not hold the order count.
- It reads on a phone. Narrow the window. Cards should stack and nothing should run off the edge.
For a longer prompt and a template to start from, see an HTML dashboard template.
Send it as a link
Paste the HTML into a NOS document and choose Create share link. HTML to link walks through it. The page renders as written, so the chart and the cards look the way they did when you tested them.
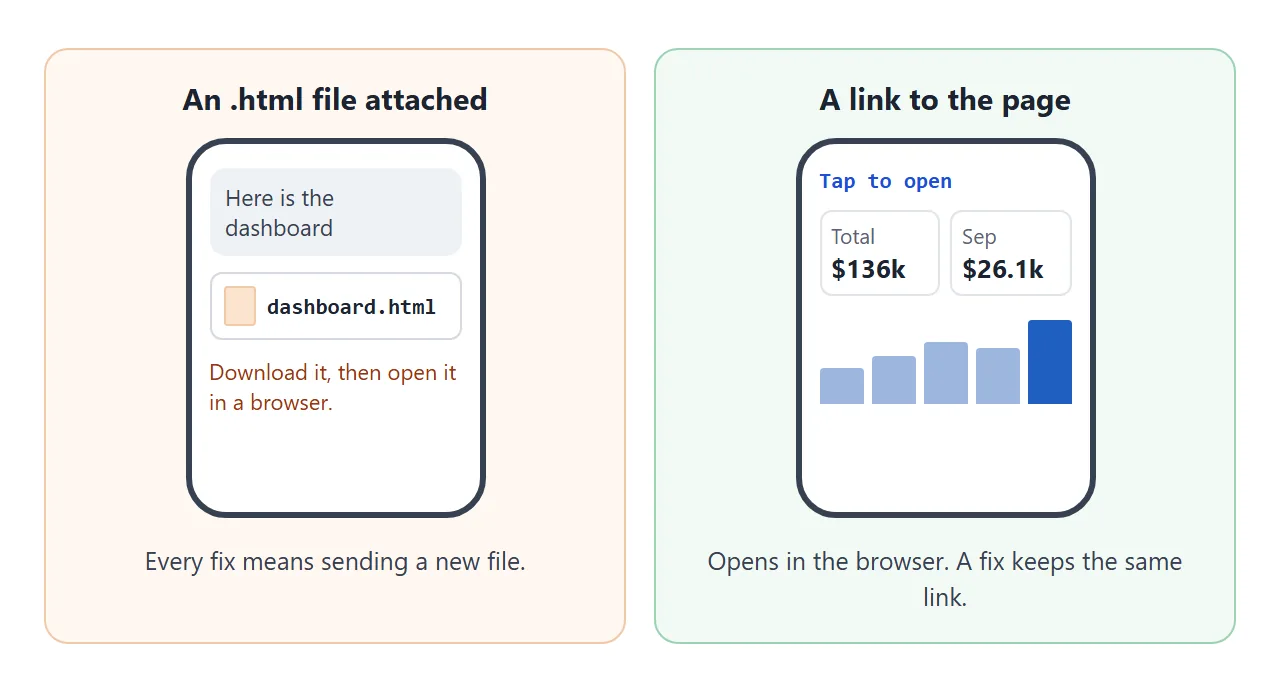
Anyone with the link can open it in a browser, phone included, without an account. They cannot edit it. If a number was wrong, change the code and the same link shows the new version. Nothing needs resending.
Where you paste the link:
- Slack. Slack's help says to paste the URL into the message field and send. Most links expand into a preview automatically, as of October 2026. There is more in sending HTML in Slack.
- Email. In Outlook for Mac, select the text and use the Insert link button or Command+K, then add the web address.
Ways to send a dashboard compared
| CSV attached | Screenshot | .html attached | Link to the page | |
|---|---|---|---|---|
| What arrives | The raw rows | A picture | A file | An address |
| Reader needs | A spreadsheet app | Nothing | A browser to open the file | A browser |
| Chart | None, they build it | Fixed image | Yes, once opened | Yes |
| Numbers copyable as text | Yes | No | Yes | Yes |
| Fixing a figure | Send a new file | Capture and send again | Send a new file | Edit, same link |
The link wins on the last row. For the longer argument, see why links beat attachments and sharing a dashboard with your team.
Let readers paste their own rows
Sometimes the person you send it to has a different set of rows. This version holds no numbers of its own. It reads whatever is in the box: a label, then a number, one row per line.
<!doctype html>
<html lang="en">
<head>
<meta charset="utf-8">
<meta name="viewport" content="width=device-width, initial-scale=1">
<title>Paste rows, see a dashboard</title>
<style>
* { box-sizing: border-box; }
body { margin: 0; padding: 18px; font-family: system-ui, sans-serif; background: #f4f5f7; color: #1d2330; }
.wrap { max-width: 760px; margin: 0 auto; }
h1 { font-size: 20px; margin: 0 0 4px; }
p.hint { margin: 0 0 8px; font-size: 13px; color: #5b6475; }
textarea { width: 100%; height: 120px; padding: 10px; border: 1px solid #c9ced8; border-radius: 8px; font: 13px/1.4 ui-monospace, Consolas, monospace; resize: vertical; }
#msg { min-height: 20px; margin: 6px 0; font-size: 13px; color: #a2410d; }
.cards { display: grid; grid-template-columns: repeat(auto-fit, minmax(150px, 1fr)); gap: 10px; margin-bottom: 12px; }
.card, .panel { background: #fff; border-radius: 12px; padding: 12px 14px; box-shadow: 0 1px 3px rgba(0, 0, 0, .08); }
.label { font-size: 12px; color: #5b6475; }
.value { font-size: 22px; font-weight: 700; font-variant-numeric: tabular-nums; overflow-wrap: anywhere; }
.bars { display: grid; gap: 7px; }
.bar { display: grid; grid-template-columns: minmax(60px, 28%) 1fr 64px; align-items: center; gap: 8px; font-size: 13px; }
.bar span:first-child { overflow: hidden; text-overflow: ellipsis; white-space: nowrap; }
.track { background: #e9ecf1; border-radius: 4px; height: 16px; }
.fill { height: 100%; border-radius: 4px; background: #9db6dc; }
.bar.top .fill { background: #1f5fbf; }
.num { text-align: right; font-variant-numeric: tabular-nums; }
</style>
</head>
<body>
<div class="wrap">
<h1>Paste rows, see a dashboard</h1>
<p class="hint">One label and one number per row. Paste cells copied from a spreadsheet, or type commas. A header row is fine.</p>
<textarea id="src" aria-label="Rows to chart">Product,Units sold
Flat white,412
Filter coffee,268
Iced latte,355
Croissant,190
Banana bread,121</textarea>
<div id="msg" role="status"></div>
<div class="cards" id="cards"></div>
<div class="panel"><div class="bars" id="bars"></div></div>
</div>
<script>
const src = document.getElementById('src');
const msg = document.getElementById('msg');
function parse(text) {
const lines = text.split(/\r?\n/).filter((l) => l.trim());
const rows = [];
lines.forEach((line) => {
const cells = line.split(line.includes('\t') ? '\t' : ',');
const n = parseFloat(String(cells[1] || '').replace(/[^0-9.\-]/g, ''));
if (cells[0].trim() && !isNaN(n)) rows.push([cells[0].trim(), n]); // a header row has no number, so it is skipped
});
return rows;
}
function show() {
const rows = parse(src.value);
const cards = document.getElementById('cards');
const bars = document.getElementById('bars');
if (!rows.length) {
msg.textContent = 'No rows found. Each row needs a label, then a number.';
cards.innerHTML = bars.innerHTML = '';
return;
}
msg.textContent = '';
const total = rows.reduce((s, r) => s + r[1], 0);
const top = rows.reduce((a, b) => (b[1] > a[1] ? b : a));
const fmt = (n) => n.toLocaleString('en-US', { maximumFractionDigits: 1 });
const card = (l, v) => '<div class="card"><div class="label">' + l + '</div><div class="value">' + v + '</div></div>';
cards.innerHTML = card('Rows', rows.length) + card('Total', fmt(total)) + card('Highest', top[0]);
const max = Math.max.apply(null, rows.map((r) => Math.abs(r[1]))) || 1;
const esc = (s) => s.replace(/[&<>"]/g, (c) => ({ '&': '&', '<': '<', '>': '>', '"': '"' }[c]));
bars.innerHTML = rows.map((r) =>
'<div class="bar' + (r === top ? ' top' : '') + '"><span title="' + esc(r[0]) + '">' + esc(r[0]) +
'</span><div class="track"><div class="fill" style="width:' + Math.max(0, r[1] / max * 100).toFixed(1) +
'%"></div></div><span class="num">' + fmt(r[1]) + '</span></div>').join('');
}
src.addEventListener('input', show);
show();
</script>
</body>
</html>
Rows copied from a spreadsheet arrive separated by tabs, and the page handles that. What a visitor types is not saved, so it is a way to look at their own numbers, not to store them.
When it does not work
| What you see | Cause | Fix |
|---|---|---|
| Totals differ from your spreadsheet | The AI added only the pasted rows, or rounded | Paste the totals, say to use only those, and recheck |
| The chart is blank | The page loads a library from a site that is not allowed | Ask for a chart drawn with divs or inline SVG |
| A logo or photo is missing | Images from other sites are blocked | Ask for text or an inline SVG instead |
| The page is tiny on a phone | The viewport meta tag is missing | Ask for it; see the viewport meta tag |
| It does not follow your CSV file | A page cannot fetch a file from another site | Paste the new numbers into the code |
| A reader's typed rows disappear | A visitor's changes are not saved | Treat the page as a viewer, or send them the link again |