An executive report template is a page whose first screen holds the findings: one sentence, three numbers and the decisions you need. Detail sits folded below. Send it as one link in an email or chat, and the reader gets the answer first.
The usual route is to ask an AI for a deck or a document, then patch it by hand. One person, writing about slide decks Claude made, said they "couldn't tweak one bullet without regenerating the whole thing."
A page avoids that. Every number lives in one block at the top, so changing a figure means changing one line. Here is a finished quarterly report for a fictional company. Open the sections at the bottom, and try it at phone width.
<!doctype html>
<html lang="en">
<head>
<meta charset="utf-8">
<meta name="viewport" content="width=device-width, initial-scale=1">
<title>Q3 leadership report</title>
<style>
  * { box-sizing: border-box; }
  body { margin: 0; background: #f3f4f6; color: #1f2937; font: 16px/1.5 system-ui, -apple-system, "Segoe UI", sans-serif; }
  .page { max-width: 760px; margin: 0 auto; padding: 20px 16px 32px; }
  .meta { font-size: 13px; color: #6b7280; margin: 0 0 4px; }
  h1 { font-size: 24px; line-height: 1.2; margin: 0 0 12px; }
  .headline { background: #111827; color: #fff; border-radius: 12px; padding: 16px 18px; margin: 0 0 14px; font-size: 18px; line-height: 1.4; }
  .tiles { display: grid; grid-template-columns: repeat(3, 1fr); gap: 10px; margin-bottom: 14px; }
  .tile { background: #fff; border-radius: 12px; padding: 12px 14px; border-top: 5px solid #9ca3af; }
  .tile.good { border-top-color: #16a34a; }
  .tile.watch { border-top-color: #d97706; }
  .tile .label { font-size: 13px; color: #4b5563; }
  .tile .value { font-size: 28px; font-weight: 700; line-height: 1.2; }
  .tile .delta { font-size: 14px; font-weight: 600; }
  .tile.good .delta { color: #15803d; }
  .tile.watch .delta { color: #b45309; }
  .tile .base { font-size: 12.5px; color: #6b7280; margin-top: 2px; }
  h2 { font-size: 17px; margin: 0 0 8px; }
  .card { background: #fff; border-radius: 12px; padding: 14px 16px; margin-bottom: 14px; }
  .ask { display: flex; gap: 10px; padding: 10px 0; border-top: 1px solid #e5e7eb; }
  .ask:first-of-type { border-top: 0; padding-top: 0; }
  .ask .n { flex: none; width: 26px; height: 26px; border-radius: 50%; background: #111827; color: #fff; font-weight: 700; font-size: 14px; display: grid; place-items: center; }
  .ask .what { font-weight: 600; }
  .ask .who { font-size: 14px; color: #4b5563; }
  details { background: #fff; border-radius: 12px; margin-bottom: 10px; }
  summary { cursor: pointer; padding: 13px 16px; font-weight: 600; list-style: none; display: flex; justify-content: space-between; }
  summary::after { content: "+"; font-size: 20px; line-height: 1; color: #6b7280; }
  details[open] summary::after { content: "\2212"; }
  .inner { padding: 0 16px 14px; }
  .bar { display: grid; grid-template-columns: 70px 1fr 52px; align-items: center; gap: 8px; font-size: 14px; margin: 6px 0; }
  .bar .track { background: #e5e7eb; border-radius: 6px; height: 14px; }
  .bar .fill { background: #2563eb; height: 14px; border-radius: 6px; }
  .bar .num { text-align: right; }
  table { border-collapse: collapse; width: 100%; font-size: 14px; }
  th, td { text-align: left; padding: 7px 6px; border-top: 1px solid #e5e7eb; vertical-align: top; }
  th { color: #6b7280; font-weight: 600; font-size: 13px; border-top: 0; }
  .chip { display: inline-block; font-size: 12.5px; font-weight: 600; padding: 1px 8px; border-radius: 999px; white-space: nowrap; }
  .done { background: #dcfce7; color: #166534; }
  .risk { background: #fef3c7; color: #92400e; }
  .track-ok { background: #dbeafe; color: #1e40af; }
  .src { font-size: 13px; color: #6b7280; }
  @media (max-width: 520px) {
    .tiles { grid-template-columns: 1fr; }
    .tile { display: grid; grid-template-columns: 1fr auto; column-gap: 10px; align-items: baseline; }
    .tile .base { grid-column: 1 / -1; }
    .headline { font-size: 17px; }
  }
  @media print {
    body { background: #fff; }
    .tile, .headline, .chip { -webkit-print-color-adjust: exact; print-color-adjust: exact; }
    details > .inner { display: block; }
    .card, .tile, details { break-inside: avoid; }
  }
</style>
</head>
<body>
<main class="page">
  <p class="meta" id="meta"></p>
  <h1 id="title"></h1>
  <p class="headline" id="headline"></p>
  <section class="tiles" id="tiles" aria-label="Key numbers"></section>
  <section class="card">
    <h2>Decisions needed</h2>
    <div id="asks"></div>
  </section>

  <details open>
    <summary>Revenue by region</summary>
    <div class="inner" id="regions"></div>
  </details>
  <details>
    <summary>Milestones</summary>
    <div class="inner"><table id="miles"></table></div>
  </details>
  <details>
    <summary>Where these numbers come from</summary>
    <div class="inner"><p class="src" id="source"></p></div>
  </details>
</main>

<script>
  // ---- Change the numbers here each quarter. The page below fills itself in. ----
  const DATA = {
    company: 'Northfield Supply Co.',
    period: 'Q3',
    audience: 'Leadership team',
    headline: 'Revenue and on-time delivery are up. The support backlog grew, and it needs a staffing decision this month.',
    revenue:   { now: 4.82, before: 4.41 },            // $ millions
    delivery:  { onTime: 9412, total: 9980, beforeOnTime: 9120, beforeTotal: 9870 },
    backlog:   { now: 212, before: 187 },              // open tickets, lower is better
    asks: [
      { what: 'Approve 3 temporary support hires for Q4', who: 'Operations', by: '15 Oct' },
      { what: 'Choose a carrier for the Southern region', who: 'Logistics', by: '31 Oct' }
    ],
    regions: [['North', 1.92], ['South', 1.18], ['East', 1.04], ['West', 0.68]],   // $ millions
    milestones: [
      ['Warehouse scanner rollout', 'Done', 'done'],
      ['Carrier contract renewal', 'At risk', 'risk'],
      ['Returns portal', 'On track', 'track-ok']
    ],
    source: 'Sample figures for this example. In a real report, name the sheet or system each number came from, and the date it was pulled.'
  };
  // -------------------------------------------------------------------------------

  const $ = (id) => document.getElementById(id);
  const pct = (a, b) => (a / b) * 100;
  const sign = (n) => (n > 0 ? '+' : n < 0 ? '−' : '');

  $('meta').textContent = DATA.company + ' · ' + DATA.audience;
  $('title').textContent = DATA.period + ' report';
  $('headline').textContent = DATA.headline;

  const r = DATA.revenue, d = DATA.delivery, b = DATA.backlog;
  const revDelta = pct(r.now - r.before, r.before);
  const onTime = pct(d.onTime, d.total), onTimeBefore = pct(d.beforeOnTime, d.beforeTotal);
  const backDiff = b.now - b.before;

  const tiles = [
    { cls: revDelta >= 0 ? 'good' : 'watch', label: 'Revenue', value: '$' + r.now.toFixed(2) + 'M',
      delta: sign(revDelta) + Math.abs(revDelta).toFixed(1) + '% vs last quarter', base: 'Last quarter: $' + r.before.toFixed(2) + 'M' },
    { cls: onTime >= onTimeBefore ? 'good' : 'watch', label: 'On-time delivery', value: onTime.toFixed(1) + '%',
      delta: sign(onTime - onTimeBefore) + Math.abs(onTime - onTimeBefore).toFixed(1) + ' points', base: d.onTime.toLocaleString('en-US') + ' of ' + d.total.toLocaleString('en-US') + ' orders' },
    { cls: backDiff <= 0 ? 'good' : 'watch', label: 'Open support tickets', value: String(b.now),
      delta: sign(backDiff) + Math.abs(backDiff) + ' vs last quarter', base: 'Last quarter: ' + b.before }
  ];
  $('tiles').innerHTML = tiles.map((t) =>
    '<div class="tile ' + t.cls + '"><div class="label">' + t.label + '</div><div class="value">' + t.value +
    '</div><div class="delta">' + t.delta + '</div><div class="base">' + t.base + '</div></div>').join('');

  $('asks').innerHTML = DATA.asks.map((a, i) =>
    '<div class="ask"><div class="n">' + (i + 1) + '</div><div><div class="what">' + a.what +
    '</div><div class="who">Owner: ' + a.who + ' · Decide by ' + a.by + '</div></div></div>').join('');

  const max = Math.max(...DATA.regions.map((x) => x[1]));
  $('regions').innerHTML = DATA.regions.map((x) =>
    '<div class="bar"><span>' + x[0] + '</span><div class="track"><div class="fill" style="width:' + (x[1] / max * 100) + '%"></div></div><span class="num">$' + x[1].toFixed(2) + 'M</span></div>').join('');

  $('miles').innerHTML = '<tr><th>Milestone</th><th>Status</th></tr>' + DATA.milestones.map((m) =>
    '<tr><td>' + m[0] + '</td><td><span class="chip ' + m[2] + '">' + m[1] + '</span></td></tr>').join('');

  $('source').textContent = DATA.source;
</script>
</body>
</html>
The first screen of the example follows four parts. The order is an editorial choice, not a standard.
- Headline – what happened, and what you need from the reader, in one sentence.
- Three numbers – each with its change from last period and the base it rests on.
- Decisions needed – each with an owner and a date.
- Detail, folded – regions, milestones and sources, open only if the reader taps.
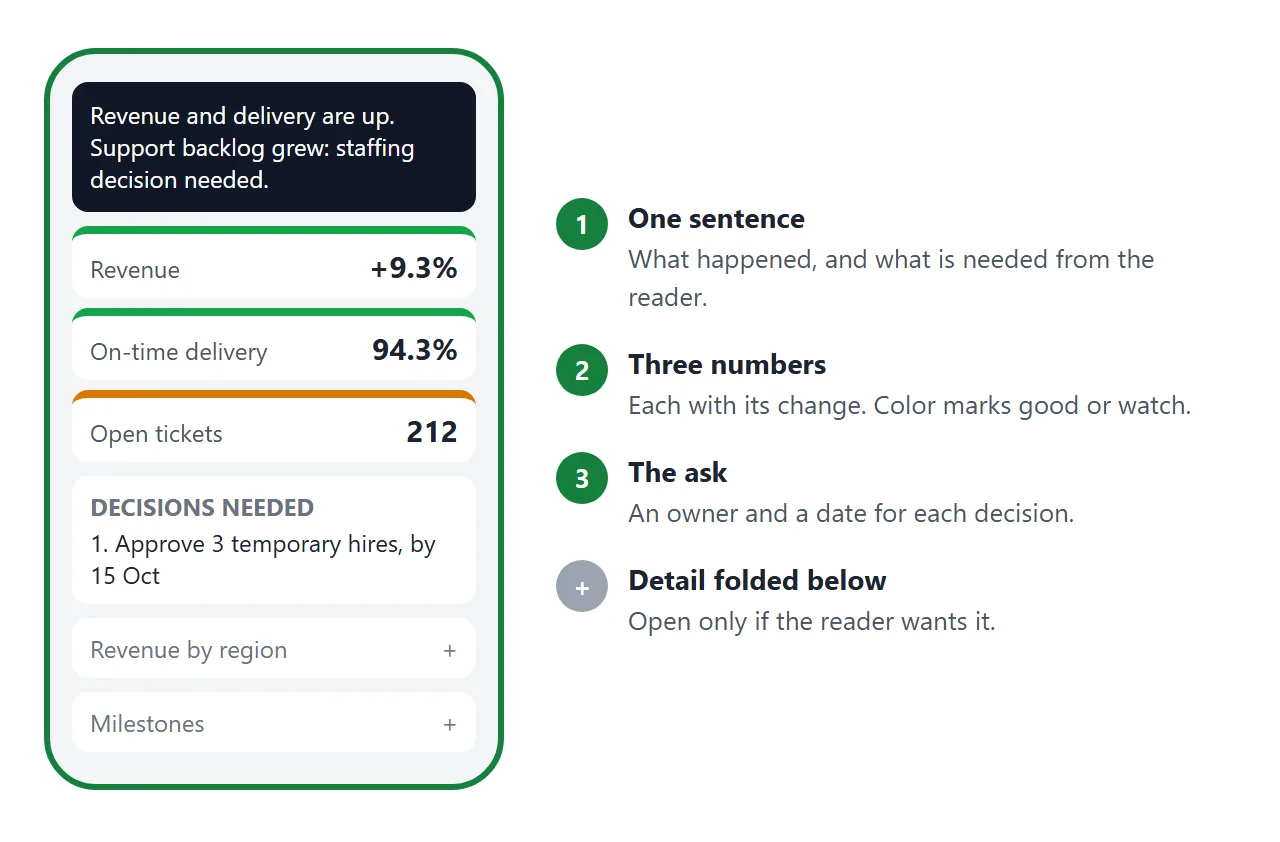
Choose the three numbers the reader would ask about first. Show each with last period's value, so "+9.3%" is never a bare figure. Where lower is better, as with open tickets, the color follows whether the move helped, not whether the number rose.
Make it with AI
Paste this into ChatGPT, Claude or Gemini. Put your own facts at the bottom.
Write ONE self-contained HTML file: a leadership report, to be read on a phone and a laptop.
Rules:
- Plain HTML, CSS and JavaScript in one file. No images, no external files, no form that sends data.
- One column, 760px wide at most. Add a viewport meta tag. Text at least 16px.
- First screen, in this order: one headline sentence; three number tiles, each with its change from last period and the base it is measured on; a list of decisions needed, each with an owner and a date.
- Below that, folded sections (details and summary) for detail, milestones and sources.
- Put every number, sentence and date in one block at the top of the script, with the comment "Change the numbers here each period". Build the page from that block.
- Use only the facts I give. If a fact is missing, write TODO. Do not invent numbers, causes or dates.
My facts:
Company and period: ...
Audience: ...
The three numbers, this period and last period, with the base: ...
What happened, in my words: ...
Decisions I need, with owner and date: ...
Detail to fold below: ...
The block-of-numbers rule is what makes a later correction a one-line edit.
What to check in the result
An AI is quick at layout and loose with facts. Read it the way leadership will.
- Every number and base. Compare each with your source, including the "last period" value.
- Every TODO. Replace it or delete the line.
- Every cause. A "because" or "driven by" is a claim. Keep it only if you established it.
- Decisions and dates. Is the owner right, and is the date one you can stand behind?
- The phone. Open it on your own phone before anyone else does.
The longer version of this check is in the HTML report template guide. If the page looks wrong, fixing AI-generated HTML covers the usual causes.
Send it as a link
Paste the HTML into a NOS document and choose Create share link. HTML to link walks through it.
You get a page anyone with the link can open in a browser, on a phone too, with no account. They can read it but not edit it. The scripts run, so the folded sections open and the numbers fill in.
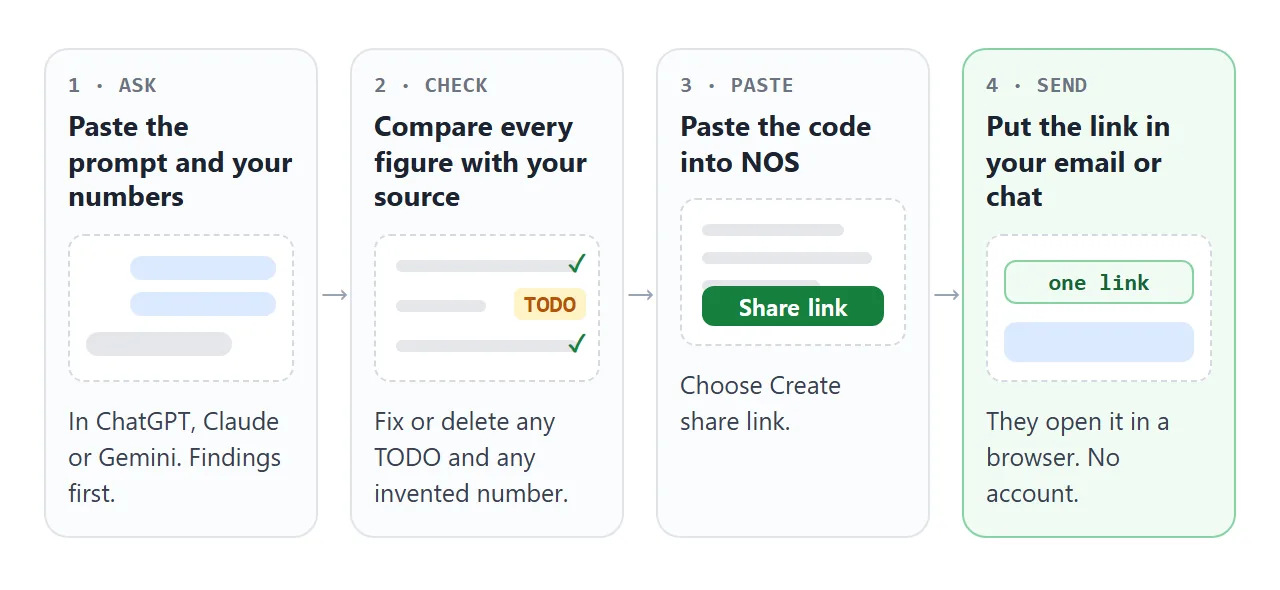
To change a figure later, open the page in NOS, edit the line in the block at the top of the script, and save. The same link shows the new version. Turning a report into a link covers the habit in more depth.
Put the headline sentence in your message, above the link. Then the reader has the answer even before they tap. A few notes on where the link goes, as of October 2026:
- Gmail. For personal accounts, Google's help page gives the attachment limit as 25 MB, and Gmail adds a larger file as a Drive link. A link has no attachment to weigh.
- Outlook. Select the words you want to turn into a link, right-click and choose Link, per Microsoft's help page.
- Slack. Paste the address into the message. Slack says most links expand into a preview, but not when a page has no preview data, so do not count on one. See sending HTML in Slack.
- Teams. Copy the link and paste it into the chat. Teams may shorten a long address for display; pasting without formatting (Ctrl+Shift+V on Windows) keeps the full one. See sharing HTML in Teams.
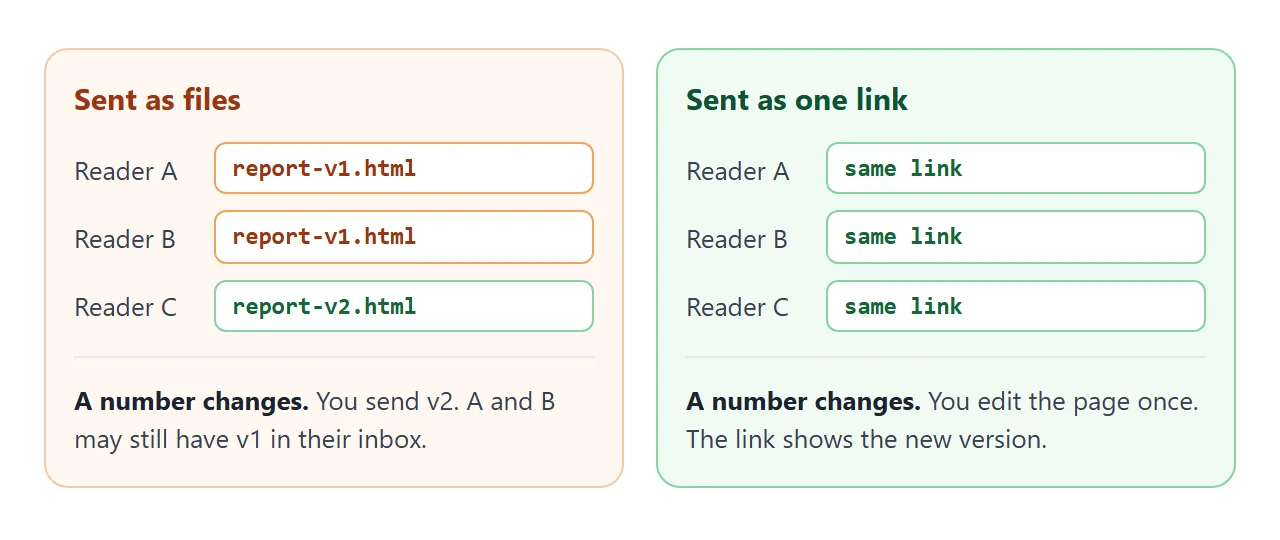
File or link: how they compare
| HTML file attached | PDF attached | One link | |
|---|---|---|---|
| Fix after sending | New file, resend | New file, resend | Edit the page, same link |
| Copies in circulation | One per recipient | One per recipient | One page |
| Narrow screen | Depends on the page | Fixed page size | Fits the screen, with a viewport tag |
| Account to read | No | No | No |
| Folded detail | Only if the file opens as a page | No | Yes |
A page needs the viewport meta tag to fit a phone. MDN explains that without it, some mobile browsers lay a page out in a wider virtual window and shrink it. For the wider comparison, see email vs link for documents.
A second layout: a status board
When the report covers many projects, a list of statuses reads faster than paragraphs. Each row carries its status as a word and as a color, and one button hides everything that is on track.
<!doctype html>
<html lang="en">
<head>
<meta charset="utf-8">
<meta name="viewport" content="width=device-width, initial-scale=1">
<title>Project status board</title>
<style>
  * { box-sizing: border-box; }
  body { margin: 0; background: #f3f4f6; color: #1f2937; font: 16px/1.45 system-ui, -apple-system, "Segoe UI", sans-serif; }
  .page { max-width: 760px; margin: 0 auto; padding: 18px 16px 28px; }
  .meta { font-size: 13px; color: #6b7280; margin: 0 0 4px; }
  h1 { font-size: 23px; line-height: 1.2; margin: 0 0 10px; }
  .summary { display: flex; flex-wrap: wrap; gap: 8px; margin-bottom: 12px; }
  .count { background: #fff; border-radius: 10px; padding: 8px 14px; font-size: 14px; }
  .count b { font-size: 22px; display: block; line-height: 1.1; }
  .filters { display: flex; gap: 8px; margin-bottom: 12px; }
  .filters button { font: inherit; font-size: 14px; padding: 7px 14px; border-radius: 999px; border: 1px solid #d1d5db; background: #fff; color: #1f2937; cursor: pointer; }
  .filters button[aria-pressed="true"] { background: #111827; color: #fff; border-color: #111827; }
  .showing { font-size: 13px; color: #6b7280; margin: 0 0 8px; }
  .row { display: grid; grid-template-columns: 1fr 110px; gap: 4px 12px; background: #fff; border-radius: 12px; padding: 12px 14px; margin-bottom: 8px; border-left: 6px solid #9ca3af; }
  .row.ok { border-left-color: #16a34a; }
  .row.risk { border-left-color: #d97706; }
  .row.off { border-left-color: #dc2626; }
  .name { font-weight: 600; }
  .note { grid-column: 1 / -1; font-size: 14px; color: #4b5563; }
  .when { font-size: 13px; color: #6b7280; }
  .chip { justify-self: end; align-self: start; font-size: 12.5px; font-weight: 700; padding: 2px 10px; border-radius: 999px; white-space: nowrap; }
  .ok .chip { background: #dcfce7; color: #166534; }
  .risk .chip { background: #fef3c7; color: #92400e; }
  .off .chip { background: #fee2e2; color: #991b1b; }
  @media (max-width: 420px) {
    .row { grid-template-columns: 1fr; }
    .chip { justify-self: start; grid-row: 1; }
  }
</style>
</head>
<body>
<main class="page">
  <p class="meta" id="meta"></p>
  <h1>Project status, end of Q3</h1>
  <div class="summary" id="summary"></div>
  <div class="filters" role="group" aria-label="Filter projects">
    <button type="button" data-f="all" aria-pressed="true">All projects</button>
    <button type="button" data-f="attention" aria-pressed="false">Needs attention</button>
  </div>
  <p class="showing" id="showing"></p>
  <div id="list"></div>
</main>

<script>
  // ---- Change the projects here. Status is one of: ok, risk, off ----
  const META = 'Northfield Supply Co. · Leadership team';
  const PROJECTS = [
    { name: 'Warehouse scanner rollout', status: 'ok',   next: 'Closed 12 Sep',   note: 'All three sites live.' },
    { name: 'Returns portal',            status: 'ok',   next: 'Launch 20 Oct',   note: 'Testing finished. Waiting on the launch date.' },
    { name: 'Carrier contract renewal',  status: 'risk', next: 'Sign by 31 Oct',  note: 'Two bids in. Decision needed on the Southern region.' },
    { name: 'Support staffing plan',     status: 'risk', next: 'Approve by 15 Oct', note: 'Backlog grew this quarter. Temporary hires proposed.' },
    { name: 'Supplier price review',     status: 'off',  next: 'Re-plan by 8 Oct', note: 'Two suppliers have not sent revised prices.' },
    { name: 'Staff handbook update',     status: 'ok',   next: 'Review 5 Nov',    note: 'Draft with HR.' }
  ];
  // -------------------------------------------------------------------
  const LABEL = { ok: 'On track', risk: 'At risk', off: 'Off track' };
  const $ = (id) => document.getElementById(id);
  let filter = 'all';

  $('meta').textContent = META;
  $('summary').innerHTML = ['ok', 'risk', 'off'].map((s) =>
    '<div class="count"><b>' + PROJECTS.filter((p) => p.status === s).length + '</b>' + LABEL[s] + '</div>').join('');

  function draw() {
    const shown = PROJECTS.filter((p) => filter === 'all' || p.status !== 'ok');
    $('showing').textContent = 'Showing ' + shown.length + ' of ' + PROJECTS.length + ' projects';
    $('list').innerHTML = shown.map((p) =>
      '<div class="row ' + p.status + '"><div><div class="name">' + p.name + '</div><div class="when">' + p.next +
      '</div></div><span class="chip">' + LABEL[p.status] + '</span><div class="note">' + p.note + '</div></div>').join('');
  }

  document.querySelectorAll('.filters button').forEach((btn) => {
    btn.addEventListener('click', () => {
      filter = btn.dataset.f;
      document.querySelectorAll('.filters button').forEach((x) => x.setAttribute('aria-pressed', String(x === btn)));
      draw();
    });
  });
  draw();
</script>
</body>
</html>
A visitor's taps are not saved, so the page opens the same way for everyone. Only the owner's changes made in View mode are kept. Use this layout for the weekly view and the first one for the quarter.
When it does not work
| What you see | Cause | Fix |
|---|---|---|
| The page shows raw code in the chat | You copied the chat text, not the code block | Copy only the code, from the doctype line to the last html tag |
| One number is wrong | The AI guessed or rounded a figure | Compare with your source, then fix that line in the block |
| A logo or chart image is missing | Images from other sites are blocked | Ask for no images, or one drawn in SVG |
| The text is tiny on a phone | No viewport meta tag | Ask the AI to add one, and a 16px base size |
| A reader quotes an old figure | They opened an old attachment | Send only the link, never the file |
| Slack or Teams shows no preview | A preview needs data the page may not have | Write the headline in your message |
| A request form does nothing | A form cannot send to a server from the link | Write your email address as plain text |